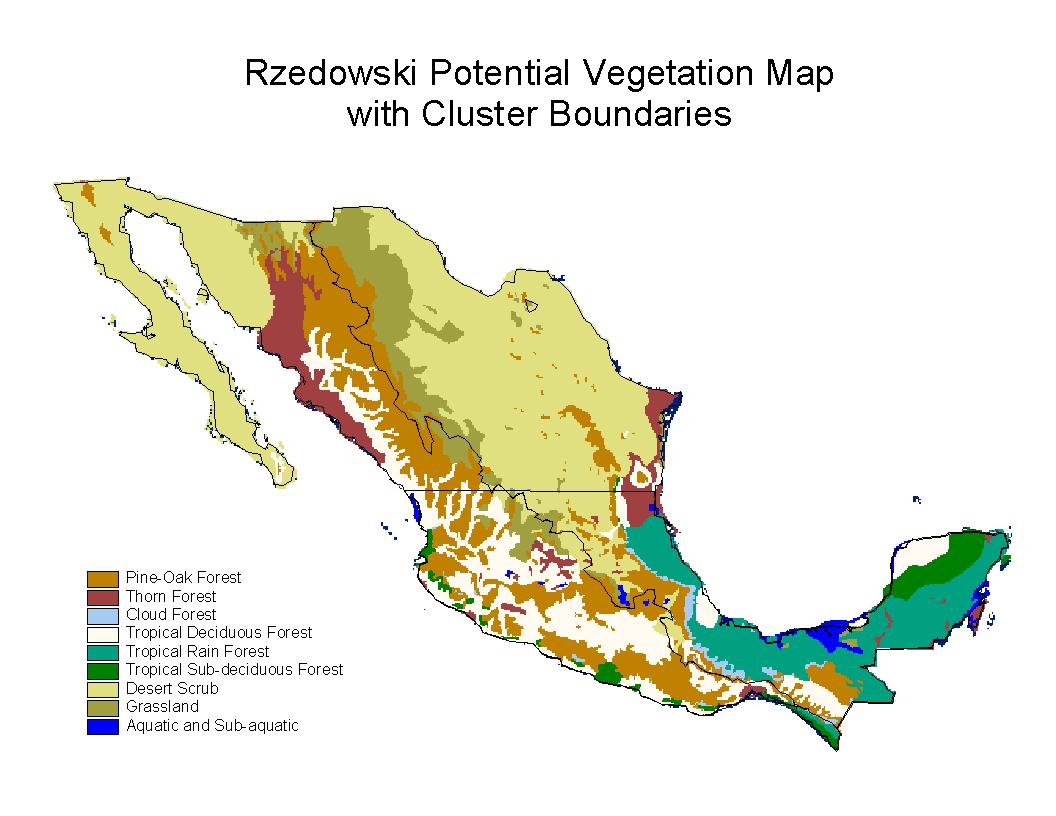
Figure 16: Major divisions seperate subregions of Mexico that were clustered
using LoiczView. The best predictions of Rzedowskis Potential Vegetation
was realized when clustering Mexico by 'ecologically similar' subregions.
Clustering with LoiczView: Thirty-eight classifications were performed, each differing in variable composition, number of clusters, distance measure, grid size, and/or grid resolution. Table 11 lists each classification including the model run name, grid resolution, cluster number, and distance measure followed by a list of the variables used in each model run.
Preliminary classifications using LoiczView were compared to each other and Rzedowskis Potential Vegetation Distribution and showed:
1. Vegetation classes that
occupied higher elevations such as Pine Oak and Tropical Deciduous were
better predicted.
2. 16-cluster classifications
were a better visual match to Rzedowskis Potential Vegetation Distribution
than were 8-cluster classifications.
3. Temperature extremes
predicted transitional areas of Pine Oak and Tropical Deciduous better
than average annual temperature.
4. Maximum Scaled Distance
measure or MSD predicted transitional areas of Thorn Forest and Desert
Scrub better than the Scaled Euclidian Distance
measure.
Figure 16: Major divisions seperate subregions of Mexico that were clustered
using LoiczView. The best predictions of Rzedowskis Potential Vegetation
was realized when clustering Mexico by 'ecologically similar' subregions.
The regionally-available Conabio climatic data were used instead of
the globally-available CRU climatic data because it was operationally easier
to use the higher resolution Conabio data sets.
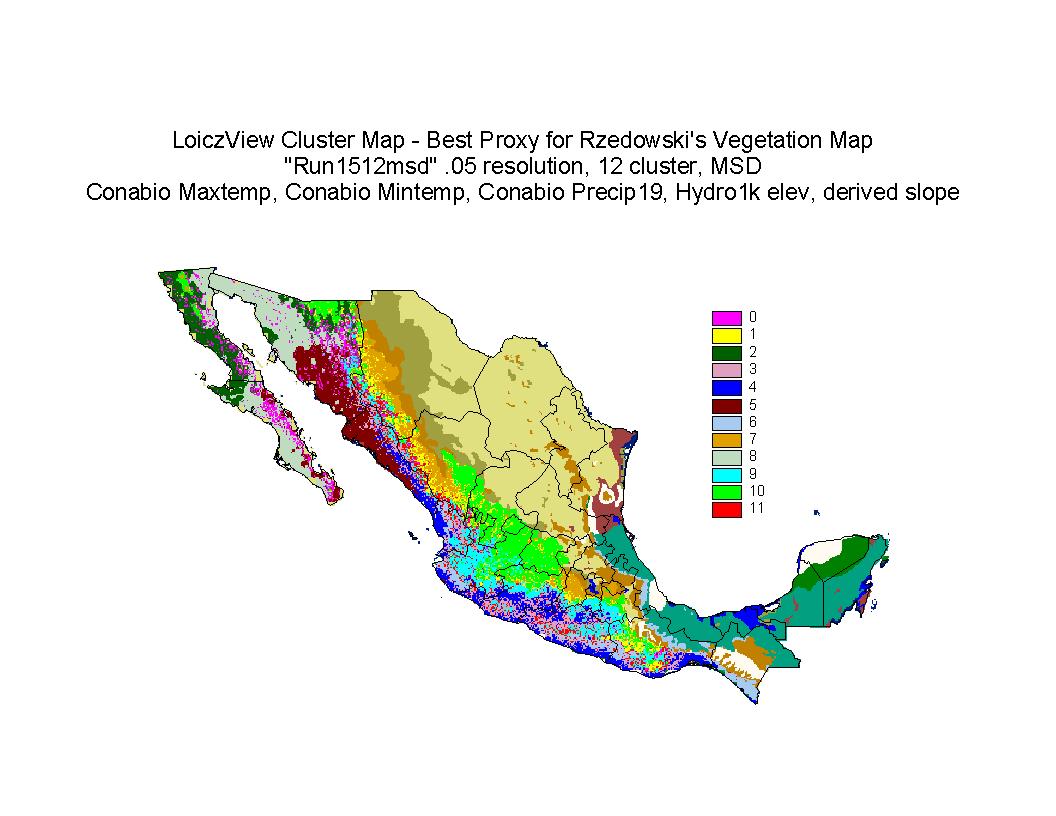
Figure 21: Classification 34 The 12-cluster best prediction of west Mexico.
Discussion: The most effective prediction for Rzedowskis Potential Vegetation was realized when clustering Mexico by 'ecologically similar' subregions.
Pine Oak, Tropical Deciduous, Thorn, and Desert Scrub were among the best predicted vegetation classes and Grassland and Tropical Rain Forest were among the worst. Cloud Forest, Tropical Sub-Deciduous and Aquatic/ Sub-Aquatic were not predicted in any of the classifications.
The vegetation classes with significant elevation components, such as Pine Oak and Tropical Deciduous, were better predicted than vegetation classes without significant elevation components, such as Tropical Rain Forest and Desert Scrub.
Vegetation distribution in west Mexico was by far the best predicted of the regional classifications. Regional differences in the ability to predict vegetation distributions varied because of the parameters used in the classifications (such as environmental data that was highly correlated to elevation, topographically or (natural) historically complex regions may be better identified by different data, MSD more appropriate for prediction of vegetation characterized by environmental extremes).
The vegetation classes with a higher number of species were represented
by more clusters as compared to the vegetation classes with a fewer number
of species. For example, LoiczView produced several clusters to account
for the overall species variation contained in Desert Scrub where as only
one or two clusters accounted for the overall species variation contained
within Pine Oak.
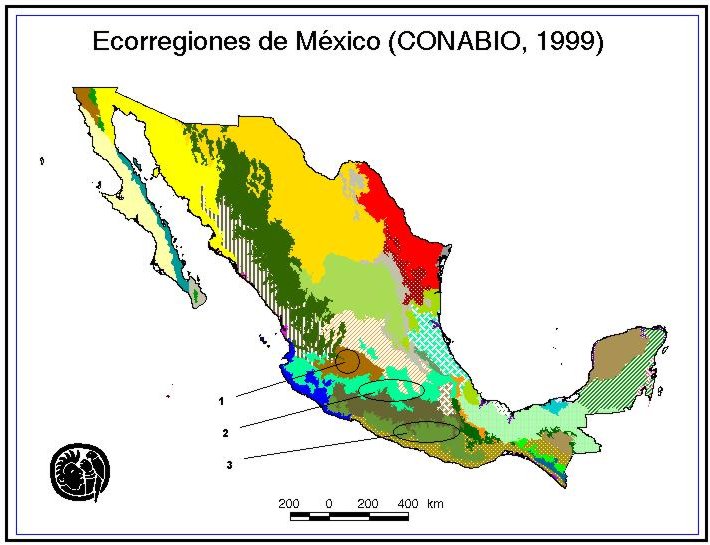
Source: (CONABIOs EcoRegions of Mexico).
Figure 22: Distribution of CONABIOS Ecoregions of Mexico.
Identified Areas: Circles 1, 2 and 3 = CONABIOs Ecoregions.
Accuracy Assessment for LoiczView: Classifications were compared visually between current and previous classifications and to Rzedowskis Potential Vegetation. Classification 34 (see Figure 21), visually the best prediction of potential vegetation distribution, was assessed for accuracy using error matrices, users and producers accuracy, overall accuracy and the kappa statistic. Classification 34 used Conabios maximum temperature and minimum temperature with Conabios precipitation (19-class), elevation, and slope at a .05-degree grid resolution and with the maximum scaled distance measure to produce a 12-cluster classification of west Mexico.
Table 12: Accuracy Assessment for Classification 34: A correspondence
analysis
between Classification 34 and Rzedowskis Potential Vegetation Distribution.
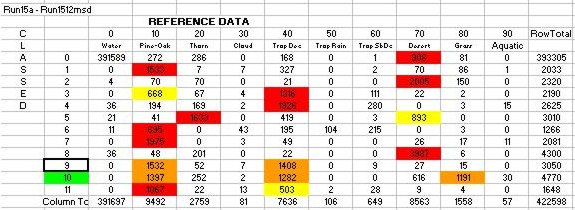
Table 13: Accuracy Assessment for Classification 34: An error matrix
identifying the % Area of a cluster being vegetation class X
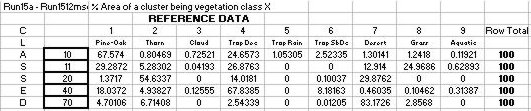
Table 14: Accuracy Assessment for Classification 34 without the mystery
cluster: Producers,
Users and Overall Accuracies, and the Kappa Statistic.
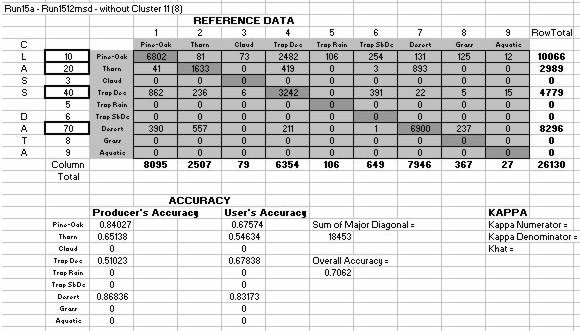
Table 15: Accuracy Assessment for Classification 34 with the mystery
cluster:
Producers, Users and Overall Accuracies, and the Kappa Statistic.
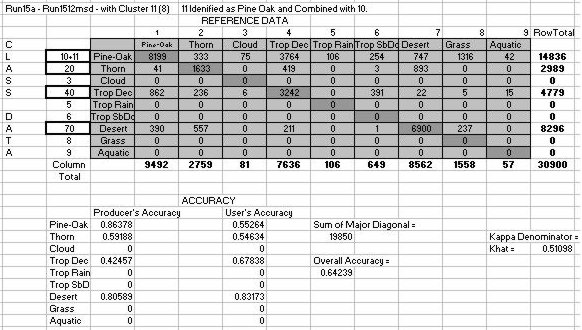
In sum, several of the vegetation classes were well predicted.
Desert Scrub was the best predicted but Pine Oak, Tropical Deciduous and
Thorn Forest were also well predicted. A 10% degradation in accuracy
for Tropical Deciduous (Producers Accuracy) and Pine Oak (Users Accuracy)
occurred when the mystery cluster was included in the accuracy assessment.
Overall accuracies were respectable with a 71% accuracy for the classification
without the mystery cluster and a 64% accuracy with the mystery cluster.
Comparing Clustering using LoiczView and Imagine: Results of the accuracy assessments for the best classifications of Rzedowskis Potential Vegetation Distribution using ERDAS Imagine and LoiczView showed that the predictive ability of each vegetation model was slightly different (see Table 10 and Table 15). Both models produced four vegetation types with Pine Oak, Tropical Deciduous and Desert Scrub common to both. Different were Tropical Rain Forest produced by Imagine, and Thorn Forest produced by LoiczView. Overall, accuracies were greater using LoiczView (except the Producers Accuracy for Desert Scrub and Users Accuracy for Pine Oak). The overall accuracy was 64% and the Kappa statistic was 51% for LoiczView where as the overall accuracy was 62% and the Kappa statistic was 48% for Imagine.
Differences in the accuracies of each model probably exist because of
the differences in clustering algorithms, distance measures, data sets,
and the area classified. Differences in the vegetation types produced
by each model probably exist because of many of the same reasons, but the
area classified is potentially the most important reason.