Core/ Periphery Approach to Modeling
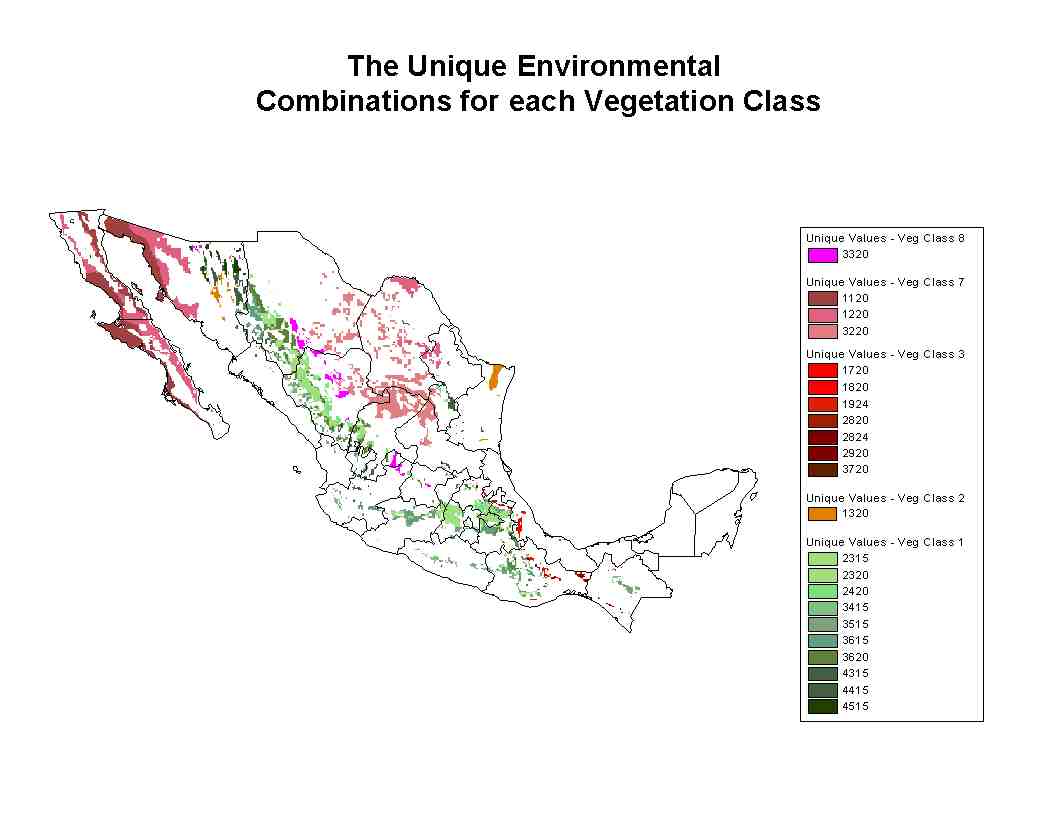
Figure 12: Core/ Periphery Approach - Core Areas of vegetation or unique
combinations of environmental values for Grassland, Desert Scrub, Cloud
Forest, Thorn Forest, and Pine Oak Forest are identified using ArcView.
Figure 12 suggests that there is ecological reality to the core/ periphery
approach for at least some vegetation types. With refinements the
approach may be useful in modeling the distribution and probable changes
of potential vegetation.
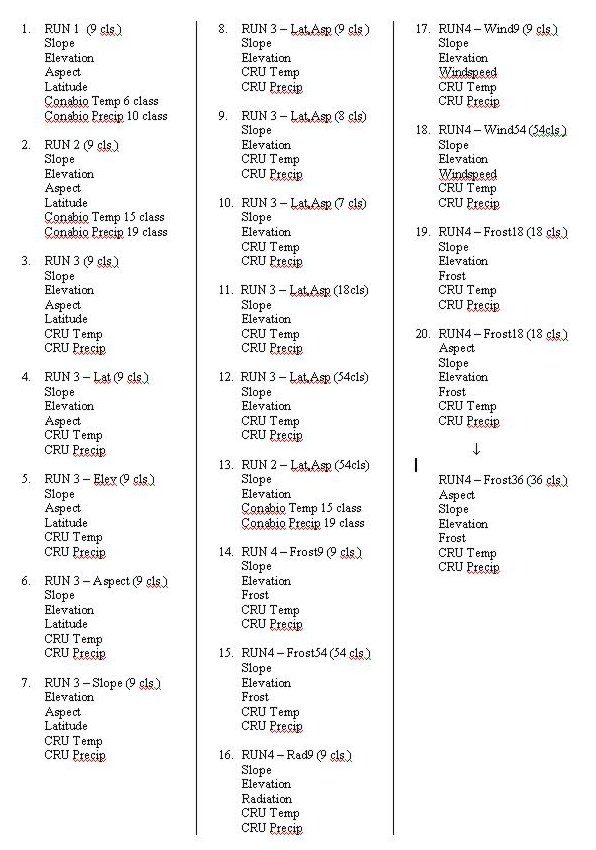
Clustering with Imagine: After several core
areas were identified in ArcView, ERDAS Imagine was used to cluster larger
sets of environmental variables, in hopes, that clustering would better
delineate both core and periphery areas of each vegetation class, and ultimately,
help prediction of potential vegetation distribution. Table 6 identifies
the twenty unsupervised classifications performed using Imagine, as well
as the variables used in each model run and the number of clusters produced
(in parentheses).
Table 6: A list of the twenty ERDAS Imagine classifications
used for the Core/ Periphery Approach to modeling vegetation
Using Higher vs. Lower
Resolution Data Sets: Classifications 1 and 2 that utilized higher
resolution climatic data (.01-degree) were both visually and statistically
very similar to Classification 3 that utilized lower resolution climatic
data (.50-degree).
Table 7: Error Matrices Comparing Higher vs. Lower Resolution Data Sets.
Values in the error matrix representing the area of each vegetation class
contained within each cluster were also very similar between high resolution
and low resolution classifications.
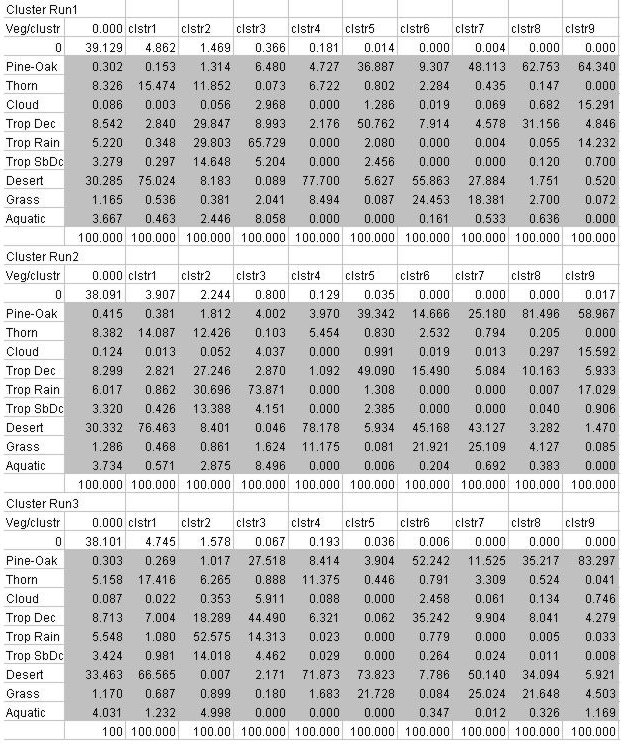
These preliminary results showed that the lower resolution (0.50-degree)
CRU global data sets worked as well as the nominally higher resolution
Conabio data sets in predicting potential vegetation distribution.
These results are encouraging because use of lower resolution, global
data sets can provide a suitable amount of detail, as well as, having the
benefits of global-availability (easily accessible, internally consistent
data sets) and usability (manageable file sizes).
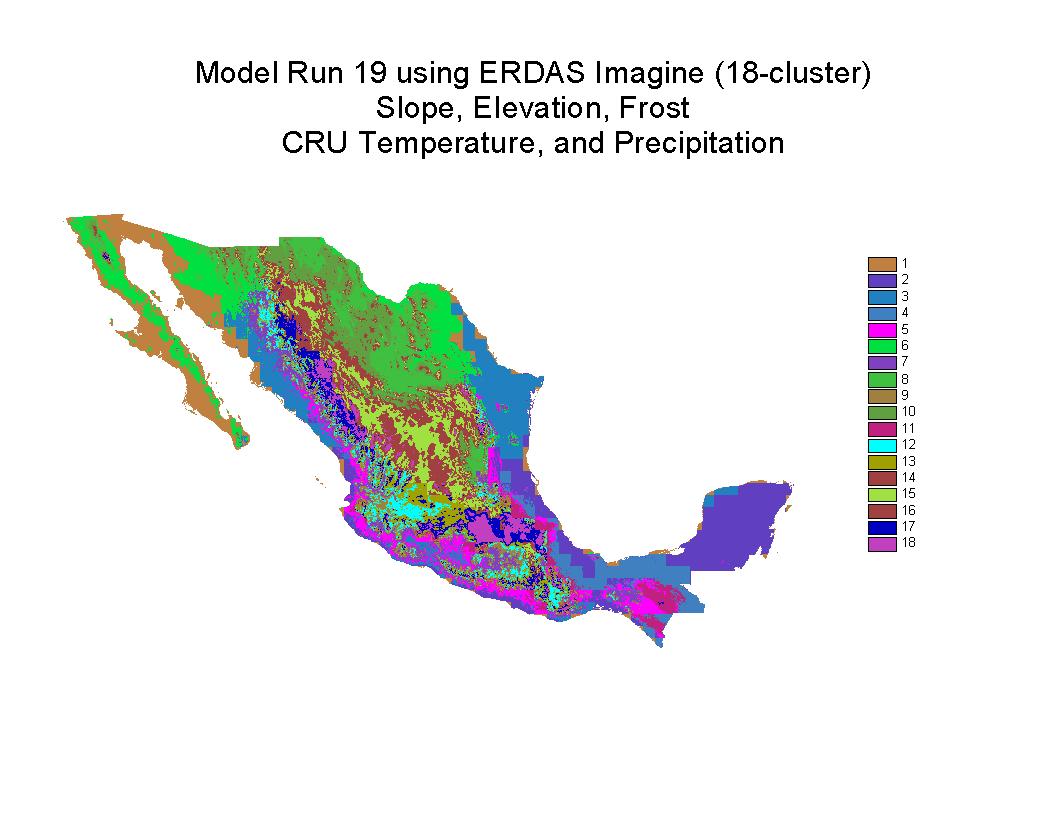
Figure 13: Classification 19 The best prediction of Rzedowski's Vegetation
Distribution is an 18-cluster classification using slope,
elevation, frost, and CRUs temperature and precipitation. Each
cluster is arbitrarily colored and numbered.
Results of Clustering with Imagine showed the globally-available CRU
temperature and precipitation, as well as, slope, elevation, and frost
(# of frost days per year) were the most effective predictors of vegetation
distribution.
The globally-available CRU temperature and precipitation performed as
well as the regionally-available Conabio temperature and precipitation
in Classifications 1, 2, and 3 (see Use of Higher vs. Lower Resolution
Data Sets).
Accuracy Assessment:
Table 8: Accuracy Assessment for Classification 19: A correspondence
analysis
between Classification 19 and Rzedowskis Vegetation Distribution.
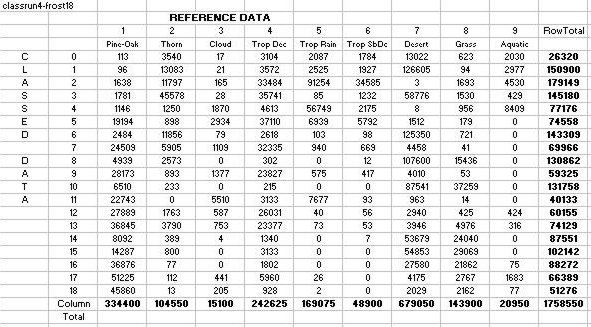
Table 9: Accuracy Assessment for Classification 19: An error matrix
identifying the % Area of a cluster being vegetation class X
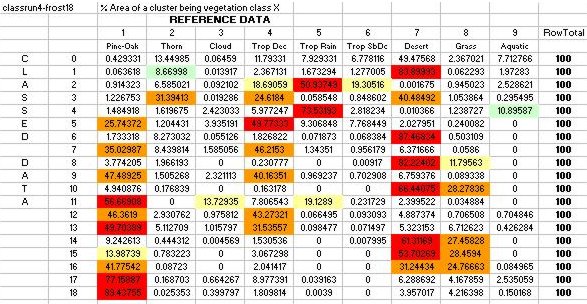
Table 10: Accuracy Assessment for Classification 19: Producers, Users,
and Overall Accuracies, and the Kappa Statistic.
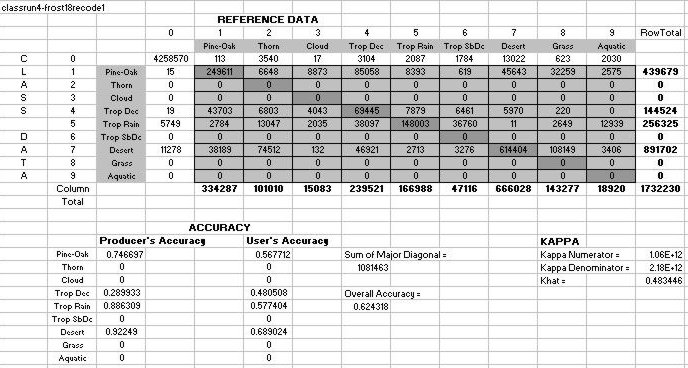
Results of performing the accuracy assessment indicated that four classes
were identified, specifically Pine Oak, Tropical Deciduous, Tropical Rain,
and Desert Scrub, with varying accuracies. Other classes were not
identified because they accounted for a minority of the variation found
within their respective clusters.
Core/ Periphery Identification:
Each
value or area within the error matrix (see Table 9) was color-coded to
correspond to the number of vegetation classes described by each cluster.
Clusters representing one vegetation class could be considered as core
vegetation areas, while clusters representing two or more vegetation classes
could be considered as a combination of a core vegetation area (the dominant
red vegetation class that occupies the most area) and peripheral areas
(orange and yellow vegetation classes that occupy minority areas within
a cluster).
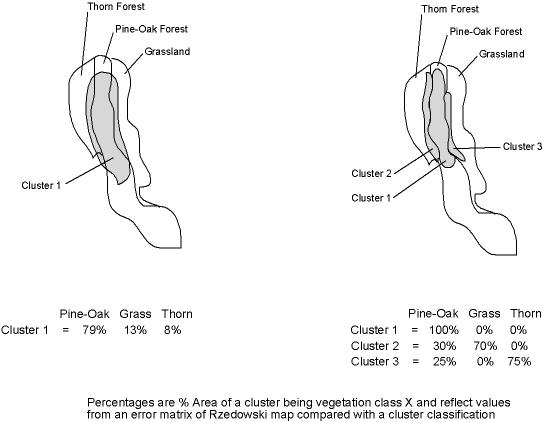
Figure 14: How re-clustering data might facilitate the Core/ Periphery
Approach to
Modeling Potential Vegetation Distribution.
If the environmental data were clustered again in a way that would preference
grouping these similar subclasses of vegetation together (i.e., the color-coded,
core and peripheral areas), then this methodology would be a valid approach
to defining core and peripheral areas for each vegetation type.
Existing clusters in Classification 19 were reclassified to represent
core and peripheral areas for each vegetation class, but results of the
reclassification showed that new clusters did not cluster on the core and
peripheral areas identified in Table 9.
Fieldwork: Results of the fieldwork support
the hypothesis that core and peripheral areas of vegetation do exist and
that the core areas are the most distinctive. Core areas were visually
the most unique areas of the vegetation class. Peripheral areas were
visually less unique and had similarities to other vegetation classes.
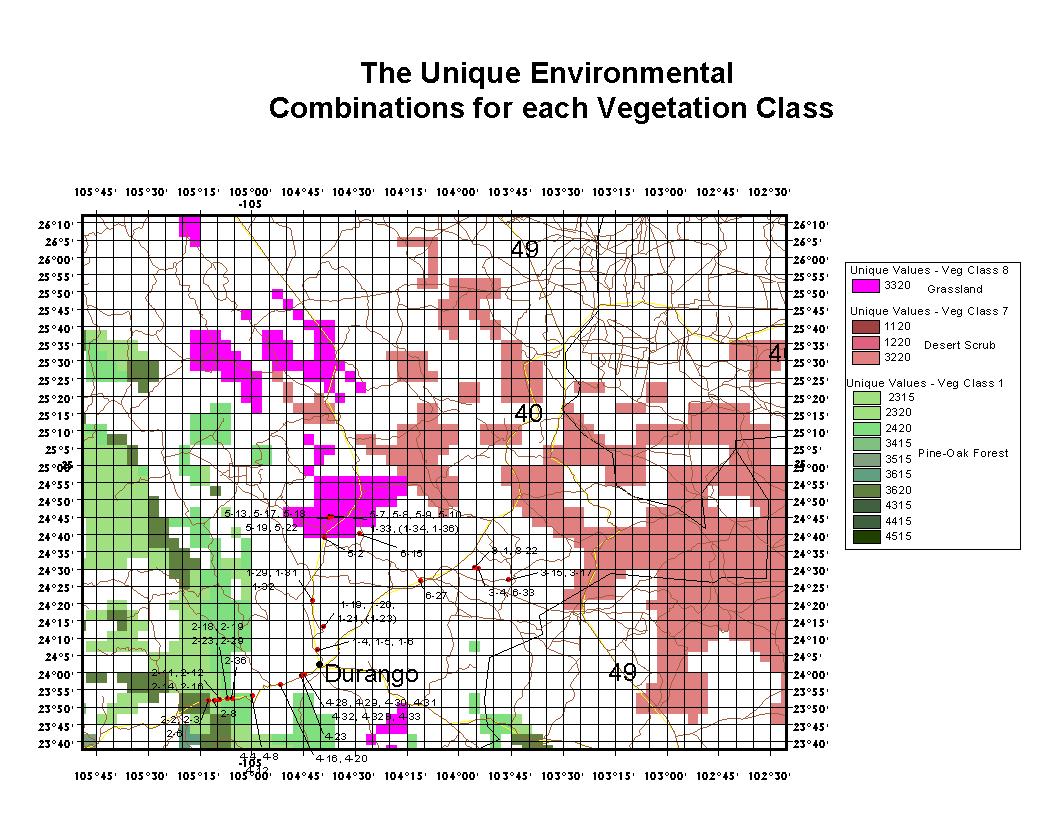
Figure 15: Unique combinations of environmental values for Pine Oak
Forest, Grassland, and Desert Scrub and surveyed locations around Durango,
Mexico Study Area for Fieldwork.
Discussion:
The core/ periphery approach appears to be an effective approach to
modeling vegetation distribution. The identification of possible
core and peripheral clusters within Table 9 showed that it should be possible
to cluster core and peripheral areas of at least some major vegetation
classes, which would be a significant step towards implementing the core/
periphery approach to modeling the distribution of potential vegetation.
It retrospect, it was simplistic to think that re-classifying the data
using only a greater number of clusters would better delineate core and
peripheral areas of vegetation. Future work should explore the classification
process, specifically, how to better control the way in which the clustering
algorithm clusters familiar points. More user control over the clustering
could help to cluster the color-coded, core and peripheral areas identified
in Table 9 facilitating the application of the core/ periphery approach
to modeling the distribution of potential vegetation.
home
Modeling Potential Vegetation Distribution