|
|
|
|
October 2004 Site Visit--Fourth Monitoring Survey |
|
|
|||
Over 790 shot stations were recorded during the October 2004 monitor survey. Data quality overall was good with a slight increase in signal-to-noise ratio that was attributed to a decrease in the average wind speeds over the recording period and increased soil moisture conditions as a result of a wetter than normal fall. Average daily production was around 150 shot stations.
Figure 1--David Thiel operating the IVI minivib2 with GPS tracking and guidance system. A two-to-four-times increase in power was obtained after installation of an Atlas rotary-style servo valve in comparison to the factory Moog valve.
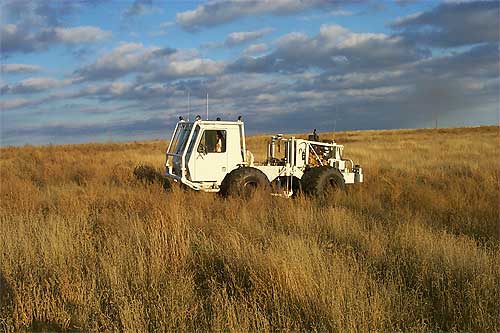
Equipment and parameters used during the October 2004 survey were as near identical to those used during the previous four surveys (baseline and three monitor surveys) as possible. The IVI minivib2, outfitted with a GPS tracking system, occupied the designed source stations with the exception of three on sandbars (too wet and represented an elevated equipment risk), six in a milo field ready for harvest, and one due to construction of a new pond (Figure 1). All shots were recorded with a Geometrics StrataVisor NZC controller operating ten 24-channel Geodes deployed along five 48-channel survey lines (Figure 2). An eleventh Geode was used to record the pilot, which was sent via radio to the recording vehicle from the vibrator. Three 10 Hz Mark Products Ultra geophones were planted in a triangle measuring about a half-meter on a side centered on the GPS-located station.
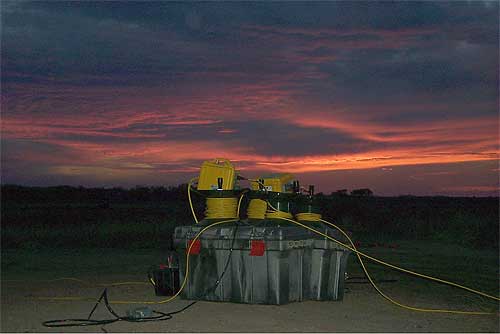
Figure 2--Sunset during October 2004 survey. Some data were collected at night to avoid wind noise that increased during the afternoons.
With no moisture and daytime temperatures in the 70s to 80s, data acquisition progressed rapidly (Figure 3). The one-square-mile survey area was covered in just over six days. More than 60 Gigabytes of data were recorded during this campaign. Data were transferred each day from the hard drive on the controller to the computers located in the mobile processing vehicle via Ethernet. Once the data were transferred to truck-mounted computers, the data were checked for quality and analyzed to determine if the overall data set would benefit from the reoccupation of any shot stations. In general about 15% of all stations were reoccupied in an attempt to improve the signal-to-noise ratio (S/N).
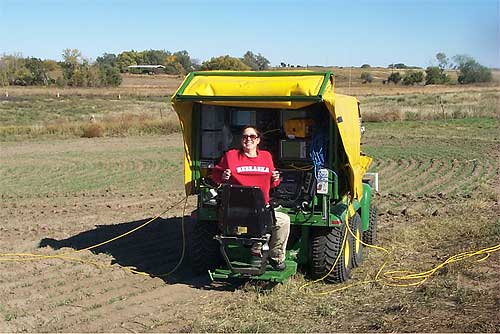
Figure 3--Weather was very pleasant most days with highs in the 70s to 80s and lows around 40. The seismic recording vehicle housed the Geometrics NZC controller and one Geode used to record the vibrator ground force. All data were transmitted to the recording vehicle from the other ten Geodes via ruggedized Ethernet cables. Graduate student Theresa Rademacker of Lincoln, Nebraska, recorded data and performed initial data quality control monitoring of the 240-channel uncorrelated vibroseis data and ground force pilot trace.
Reduction in wind noise was routinely possible during night acquisition in comparison to during the average day at this site. Clear nights with light and variable winds were the rule, allowing large time windows without interruptions and stoppages due to weather noise. During night shooting, the increased safety and productivity actualized by using the DGPS route and tracking system was dramatic. Even with the very rough and sometimes treacherous terrain around the Smoky Hill River on dark nights (no moon luminance or cloudy) production rates exceeding 15 shot stations per hour were easily maintained. Once the vibrator operator became accustomed to using the computer/DGPS route and tracking system, the only reason to look outside the cab was to make sure obstacles such as tree limbs or ditches dug, appearing since last survey, were not in the vibrator's path.
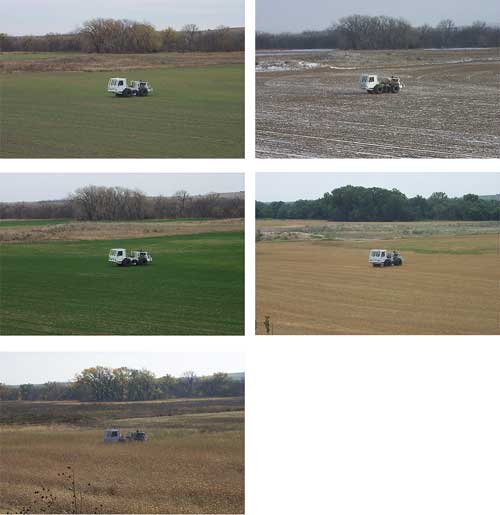
Surface conditions, especially the vegetation, changed noticeably throughout the first year (Figure 4). Soil moisture conditions changed as evident in slight changes in weathering velocity calculated from first arrivals. Only during the January 2004 survey was the ground frozen. Little change in data quality was observed that could be directly related to that particular ground condition. The normal crop cycle for dryland wheat grown in this part of the Midwest is two years long and includes a growing year and a fallow year. During the fallow year, volunteer vegetation (grasses and weeds) grow rapidly.
Figure 4--November 2003 survey (upper left), January 2004 survey (upper right), March 2004 survey (middle left), June 2004 survey (middle right), and October 2004 survey (lower left).
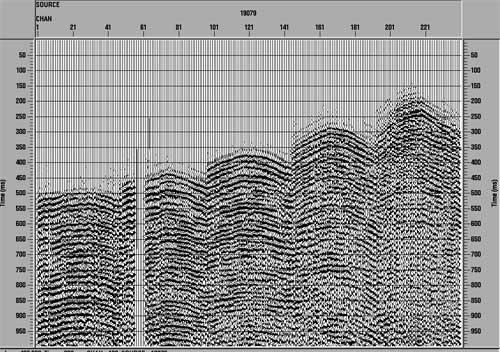
An increase in the S/N was observed on data from the October 2004 survey (Figure 5). As previously noted, this increase in signal is likely related to increased soil moisture and reduced average wind speed during the recording of these 790+ shot stations. Reflection events are very coherent and possess a reasonably broad bandwidth. Reflections arriving at 850 msec and deeper at source offsets in excess of 1 km have excellent signal strength and with sufficient coherency to estimate velocity.
Figure 5--A 240-channel shot gather from station 19079. Reflection events dominate the four-shot vertically-stacked shot gather. Coherency of events is excellent and the dominant frequency of this unfiltered shot record is around 80 Hz. After spectral balancing the dominant easily exceeds 100 Hz. A larger version of this figure is available.
|
Kansas Geological Survey, 4-D Seismic Monitoring of CO2 Injection Project Placed online April 14, 2005 Comments to webadmin@kgs.ku.edu The URL is HTTP://www.kgs.ku.edu/Geophysics/4Dseismic/Reports/Oct_2004/index.html |