|
|
|
|
Nov. 2003 Site Visit--Baseline Data Acquisition |
|
|
|||
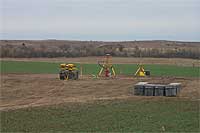
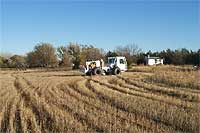
Acquisition of the baseline 3-D survey for the 4-D seismic monitoring project began on November 5, 2003, in anticipation of the scheduled start up of CO2 injection on November 20, 2003. Digital data from preliminary GPS surveys were used to guide physical site preparations and were integral to the construction of an extremely accurate and precise station grid map. The station grid map incorporated the 3-D seismic survey designs with the site-specific information and allowances for surface obstacles. Ensuring the placement precision of this and all repeat source and receiver line deployments will be critical to difference processing. Digital terrain maps with vibrator routes were built for all 800+ source locations across the site. Considering the six-year duration of this surface seismic monitoring project, time spent at this stage to accurately map each detail of the data acquisition phase will ensure maximum correlations between repeat surveys and minimize the need for radical equalization procedures during data processing.
| Click on any photo to view a larger version | |
|---|---|
 |
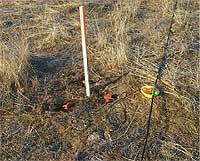 |
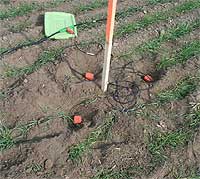
Each receiver line was located with a Trimble DGPS to ensure straight grid lines, with deviations in line-to-line spacing not exceeding a couple percent (1 m to 2 m). Three Mark Products U2 10 Hz geophones with 14 cm spikes were placed at the point of a 1/2-m equilateral triangle centered on the receiver station. With the receiver grid remaining on the ground for up to two weeks, the geophones' connections were protected from moisture and ground leakage by suspending them in the air with plastic bowls. This practice reduces and generally eliminates all earth signal leakage. Each receiver was planted at the base of a hole dug down through the sod and into firm soil. This ensures good coupling and reduces the effects of wind noise.
| Click on any photo to view a larger version | |
|---|---|
 |
 |
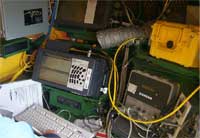
A Geometrics NZ StrataVisor was used to record data from a 24-bit A/D, 241-channel Geode distributed seismograph system. Each Geode (11 individual units) contains 24 recording channels and is connected to the StrataVisor (controller) through reinforced Ethernet cables. The StrataVisor remotely controls the entire acquisition process and provides a variety of QC functions to ensure data quality. Two Geodes were deployed for each 48-channel receiver line. Interfaced to the StrataVisor was an IVI RTS (radio control unit for communicating with the vibrator and receiving the sweep from the vibrator) delivering the ground force pilot to the StrataVisor where it is recorded on an auxiliary channel.
| Click on any photo to view a larger version | |
|---|---|
 |
 |
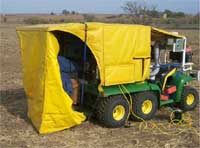
Data are recorded uncorrelated, allowing maximum flexibility during processing to enhance the high fidelity of the data through pre-correlation processing and unconventional approaches to correlation. Each sweep was recorded as a separate file, resulting in more than 4,000 files and a total of about 12 megabytes of data. Once completed a single 3-D survey will consume about 40 gigabytes of storage space. The recording system was housed on the back of a specially modified John Deere Gator 6-wheel vehicle. Due to the need for quiet operation, all power is provided by six 12-volt lead acid batteries. Temperatures below freezing required housing the operator and system inside a specially designed insulated covering previously used during KGS research north of the Arctic Circle.
| Click on any photo to view a larger version | |
|---|---|
 |
 |
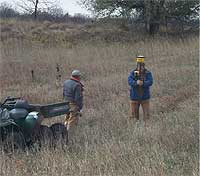
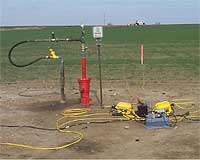
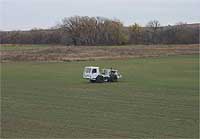
A differential GPS transmitter was set up directly over the CO2 injection well and used for vibrator guidance, receiver placement, and well locations. The transmitter was up and operational during this entire baseline survey and will be used on all future surveys to ensure all source locations are within 0.5 m of this baseline survey and receivers are placed within centimeters of their current locations.
| Click on any photo to view a larger version | |
|---|---|
 |
 |
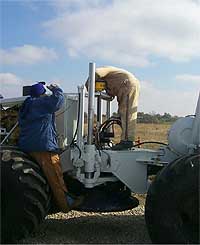
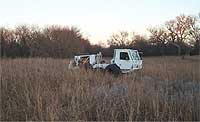
Capabilities for night operations were essential to avoid cultural and wind noise, which would severely contaminate this low-energy high-frequency data. To ensure safe and accurate movement and placement of the vibrator, a GPS guidance system specially designed at the KGS for this project was installed on the vibrator. The system allowed navigation around the site and to each shot location along predetermined optimum paths. From the cab of the vibrator the operator could move repeatedly along these predetermined routes within a few inches of the programmed safest route to a shot location, all in total darkness, if necessary. Once the vibrator was located and a sweep run, the onboard computer would log the exact pad location (within a few inches in x, y, and z).
| Click on any photo to view a larger version | |
|---|---|
 |
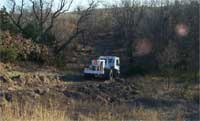 |
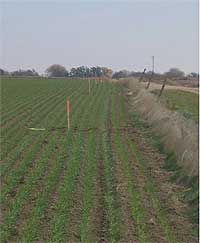
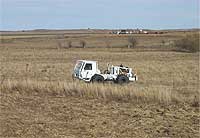
Considering the study area for the 4-D seismic survey was just over 1 square mile, the diversity in terrain was significant and provided unique challenges. Source as well as receiver coupling was critical, and for that reason five individual sweeps were recorded at each location. Each of the 10-second linear up-sweeps spanned the 20 Hz to 250 Hz frequency range in a temporally uniform fashion. The first of the five sweeps was designed to seat the pad (compact the ground sufficiently that subsequent sweeps are as consistent as possible) while the remaining four sweeps will be vertically stacked (once appropriate noise is edited from each) to enhance the signal-to-noise ratio. Areas such as freshly planted wheat fields were the softest and were the least conductive of high frequency signal. Other areas such as pastures, roads, summer-fallowed ground, waterways, alfalfa fields, and wooded areas all affected vibrator performance in slightly different ways. Of particular concern was maintaining source locations that would not only be accessible for the entire six-year duration of this study but also to minimize dramatic swings in ground conditions due to seasonal changes. Dealing with this variability in source and receiver coupling is best accomplished during the recording phase rather than relying on processing to numerically compensate for these effects.
| Click on any photo to view a larger version | |
|---|---|
 |
 |
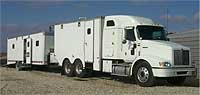
As data were acquired they were transmitted via Ethernet from the seismograph to the mobile processing center. Once data were transferred, preliminary processing was performed, which included long-term archive, format conversion, pre-correlation processing, correlation, noise editing, vertical stacking, application of geometry, and data inspection.
| Click on photo to view a larger version |
|---|
 |
During data inspection and preliminary analysis, stations that needed reoccupation and reacquisition of data were defined. Ability to identify poor data areas and redeploy the source to these areas within hours of acquisition is only possible as a result of this in-field processing capability. So far we have reacquired about 65 stations or about 8 percent of the data set. Without a doubt this will enhance the uniformity of the fold and result in a final data set with 3-D acquisition characteristics (fold, azimuthal and offset distribution, etc.) that more closely match the ideal design criteria.
A total of more than 800 240-channel shot gathers were recorded. Each shot gather is a four-shot vertical stack. Reflections interpreted on raw shot gathers were outstanding, with the dominant frequency over 90 Hz. With spectral balancing techniques, the processed dominant frequency will be around 150 Hz within the interval of interest. At this point the best time-to-depth estimates place the reservoir of interest at a time depth of around 600 to 650 msec. Once the VSP is completed (cable is on the ground ready for deployment at this writing), we will have as close to an exact time-to-depth correlation between the borehole-defined geology and seismic data as possible.
| Click on figure to view a larger version |
|---|
 |
With the in-field processing that is currently ongoing, within a few days preliminary data quality analysis will be posted at this site.
|
Kansas Geological Survey, 4-D Seismic Monitoring of CO2 Injection Project Placed online Nov. 19, 2003 Comments to webadmin@kgs.ku.edu The URL is HTTP://www.kgs.ku.edu/Geophysics/4Dseismic/Reports/Nov4_2003/baseline.html |