|
|
|
|
March 2005 Site Visit--Fifth Monitoring Survey |
|
|
|||
To date the seismic data from the baseline survey and first three monitoring surveys in January, March, and June 2004 have been first-pass processed and preliminary interpretation completed. Over the period of October 21-29, 2004, the fourth monitoring 3-D seismic survey was conducted to obtain a snapshot of the CO2, more specifically to provide clues to better understand why well #13 was not producing at the expected rate. Because of the sluggish response in #13 and the lower-than-expected yield in #12, the WAG (water alternated with gas) program was delayed. A noted increase in production in well #13 and an upward overall production trend from both the demonstration wells (#12 and #13) was reported just prior to the fifth 3-D monitor survey, which began in early March 2005. This report includes field activities for March 2005.
Production Overview
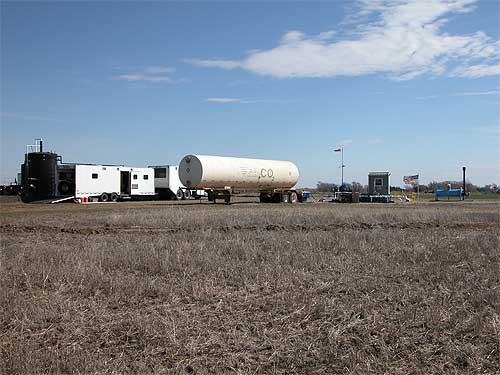
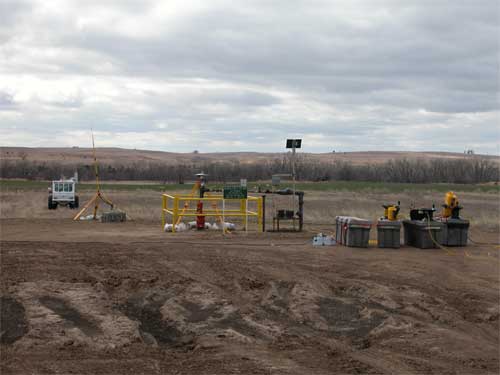
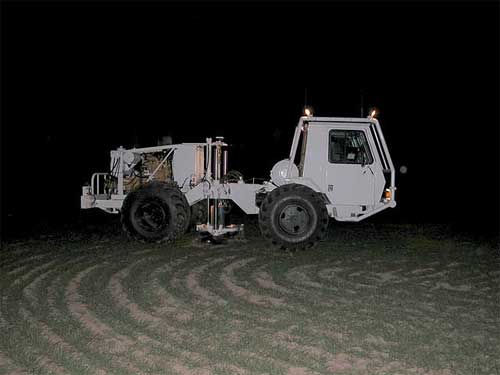
The general appearance of the site and operational aspects of the equipment have changed little in the 18 months since the project began (Figure 1). As of March 2005, CO2 is being injected at a rate varying between 2.5 g/m and 3.0 g/m, or about 20 tons/day. With just over 7,500 tons of CO2 injected through CO2#1, at a bottom hole pressure between 1800 psi and 1900 psi since December 2003, the rate of oil production from #12 and #13 has been averaging between 2.0 and 5.0 b/d since the beginning of 2005.
Figure 1--CO2 storage tank, oil stock tanks, CO2 pumping station, and seismic support vehicles in this picture taken looking northeast. Wind sock and American flag are good indicators of wind speeds exceeding 15 mph.
Site Conditions
For the most part the spread geometry has been unchanged from the initial survey, however a few physical changes on-site have required slight modifications to a few source stations. The ground conditions and land access for the March 2005 survey was consistent with previous surveys with the exception of a new drill pit and changes in the location of a brush pile, requiring skipping two points while two new points were accessed. Ground temperatures were significantly above freezing.
Changes in site conditions that affect data between the October 2004 survey and the March 2005 survey are subtle but will be noticeable on seismic data. Since these changes are both natural (soil moisture, wind, and vegetation) as well as mechanical (all pumps must remain on, more pumps currently working, and duty cycles of water injectors almost continuous), with the exception of wind noise, little can be done during acquisition to compensate for the noise.
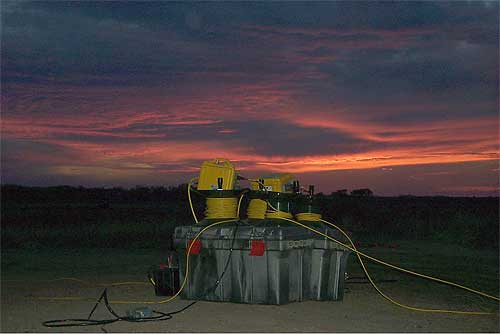
Weather during the two most recent 3-D surveys was as expected during late fall and late winter, variable. During the October 2004 survey temperatures were near perfect ranging from 40s at night to 80s during the day (Figure 2). Winds were consistently very acceptable with no data recorded when sustained winds were above 10 mph. Acquisition rates exceed 150 shot stations per day for a continuous 5-day period. During the March 2005 survey, wind conditions changed dramatically. With sustained winds exceeding 20 mph for days on end, maintaining a shooting threshold of < 15 mph required a significant number of down days and night shooting. Temperatures ranged from 20s at night to 70s during the day. Several days temperatures never exceeded 40°F with accompanying winds greater than 30 mph.
Figure 2--Sunset during October 2004 survey. Some data were collected at night to avoid wind noise that increased during the afternoons.
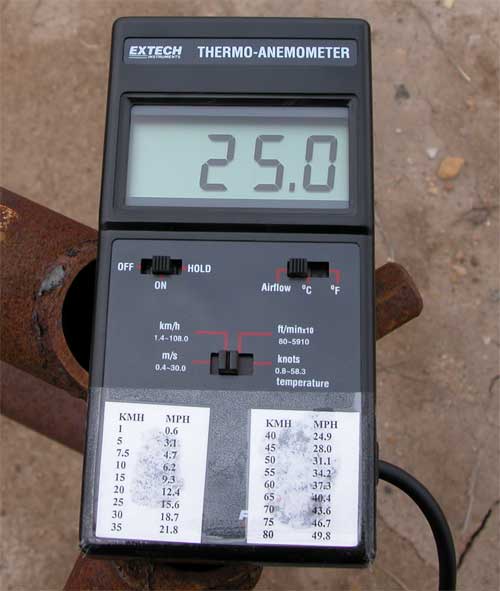
With the clear dependence of data quality on wind noise, an anemometer was used to quantify wind speeds during the March 2005 survey where previously wind speeds had been judged using a windsock (Figure 3). Data were not collected when average wind speeds exceeded 15 mph. On several occasions wind gusts exceeded 40 mph during the March 2005 survey.
Figure 3--An anemometer to allow accurate measures of wind speed correlated to those previously judged using a windsock and National Weather Service reports. When average wind speeds exceeded 15 m/h (approx. 25 km/h), the survey was halted.
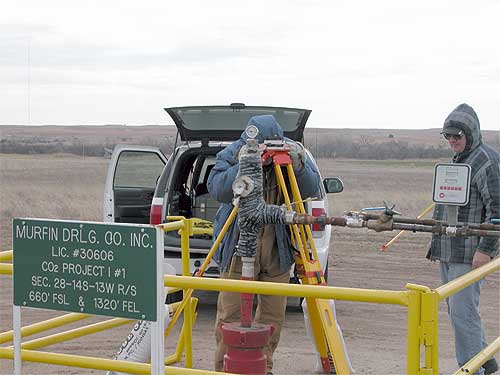
To ensure accurate repeat placement of receivers and sources, a Trimble DGPS 4800 and 4700 model system was set up and operated any time data were being acquired or the spread was being deployed (Figure 4). A survey pin, cemented in place immediately south of CO2I#1 prior to the baseline survey over 18 months ago, was established as the "permanent" marker for the entire six-year duration of this study. With winds exceeding 25 mph expected during the March 2005 survey, sand bags were used to weight the tripod legs, ensuring a rigid placement throughout the two weeks expected to complete this survey.
Figure 4--Electrical engineer Brett Bennett and geologist David Laflen level and align the DGPS tripod base prior to installation of the satellite receiver and ground plane.
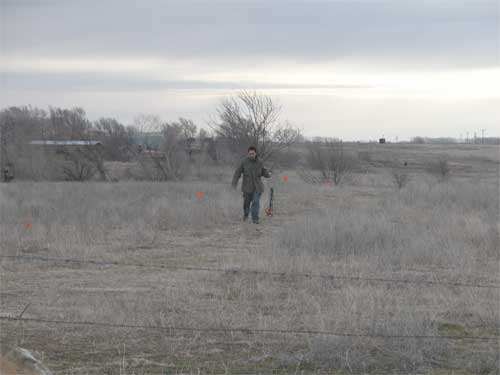
Fortunately, ground conditions were good for laying out the receiver spread (Figure 5). After three months of winter the vegetation was minimal, the ground was not frozen, and the soil and sub-soil moisture was quite high relative to the norm in this area (based on discussions with local farmers and construction workers). These conditions allowed quick geophone planting while providing excellent coupling to the earth.
Figure 5--Engineering technician Andrew Newell carrying a partial hasp of geophones to the next station along the receiver line. Flags were used to mark the receiver stations. Once the three geophones were seated into the soil, the flags were removed, avoiding noise resulting from the flag flapping in the breeze.
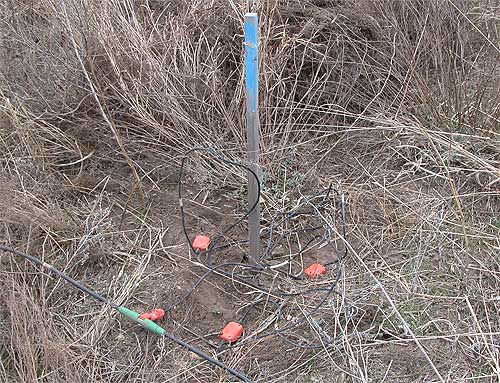
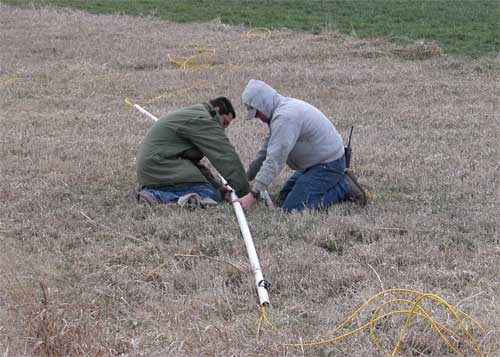
Receiver stations in areas not disturbed by seasonal agricultural activities were marked with wooden stakes that should remain in place throughout the duration of this study (Figure 6). Three Mark Products 10 Hz U2 geophones on 5-inch spikes and wired in series were firmly seated into the soil centered on the station location and separated by around 0.5 m. With receiver lines traversing soils in fields used for wheat or milo, pastures, roads, waterways, wooded areas, and sand dunes, coupling will be variable as will weathered layer velocities.
Figure 6--Set of three geophones planted along line 5 (southernmost receiver line) in an area with thick grass cover not routinely farmed.
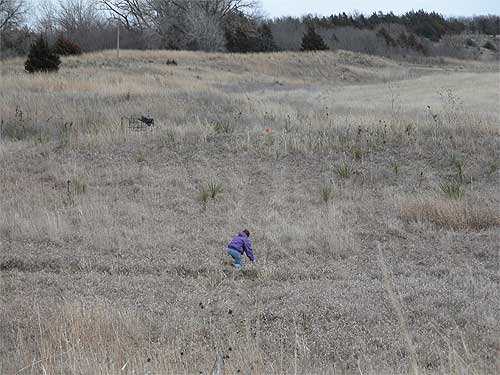
Receivers deployed in the perennial grasses required more clearing around the geophone area to minimize the noise from grasses blowing in the wind. The sand dunes along line 5 provided some of the very best receiver coupling in comparison to the other four lines in tilled fields, pastures, and road ditches (Figure 7). However, the sand dune topography did provide its own set of static problems that needed to be overcome during processing.
Figure 7--Engineering technician Nicky Proudfoot secures geophones to the analog seismic cables. With receiver stations separated by 20 m, each east/west receiver line is just less than 1 km in length.
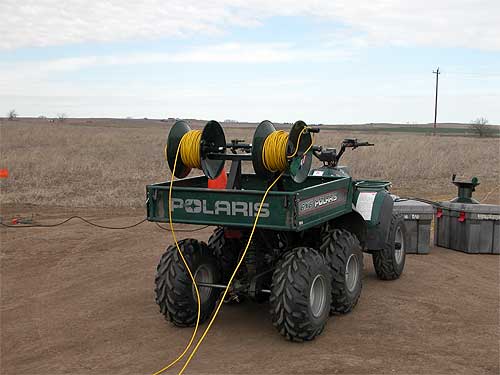
Geodes used on this survey were 24 channels per unit with all eleven Geodes connected to each other and the controller via ruggedized Ethernet cables (Figure 8). These Ethernet cable runs have very stringent length limitations and minimum coil radius to remain within the seismograph manufactures transmission specifications and to avoid cable damage, respectively. A weatherproof covering and military-grade connectors make this Ethernet cable extremely field rugged. On this project, 1900 ft of this cable in 10 separate segments were necessary to network all the seismographs with the controller.
Figure 8--A six-wheel-drive Polaris ATV with two Ethernet cable reels on a four-reel customized bracket.
Even these "ruggedized" Ethernet cables are sensitive to very small crush pressures. To avoid damage at the various road crossings, the cables were housed in PVC pipe and either buried into the unimproved roads or slid into culverts or drain tiles under roads (Figure 9). On several occasions it was necessary for the vibrator to drive over these lines. For those crossing a piece of PVC pipe was moved around and the Ethernet cable was inserted through a slit cut the length of the PVC.
Figure 9--Engineering technicians Andrew Newell and David Thiel prepare the Ethernet cable shield for insertion into a culvert under the east/west county road.
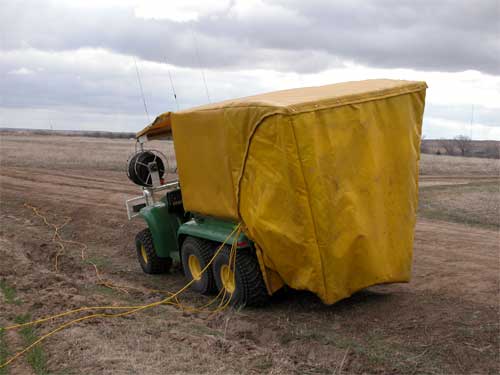
With the temperatures dipping several degrees below freezing at night, the seismic recording vehicle was outfitted with a thermal boot (Figure 10). A propane heater was used to keep the inside temperatures above 65°F. Digital lines (Ethernet) from the four electronic lines were connected to the controller's four network ports. The ground force signal calculated using the vibrator mass and baseplate acceleration measurements were transmitted real time to the seismograph via radio. This ground force signal was used as part of the QC process to verify vibrator operations were consistent with design sweep parameters.
Figure 10--John Deere Gator outfitted with cold weather cover. Propane heater keeps operator's area at room temperature when outside temperatures are well below zero Fahrenheit.
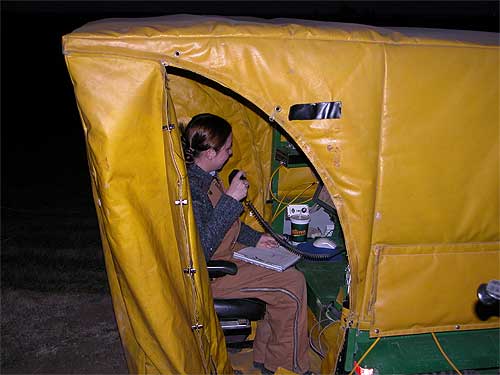
The seismic recording vehicle has enough 12-volt battery power for more than 24 hours of continuous operation (Figure 11). Besides the seismograph, vibrator controller, and VHF radio, the lights and furnace fan (propane furnace) are operated on 12-volt power. Running without a 120 VAC generator reduces noise. Each pair of Geodes positioned along the five analog receiver lines shared a 12-volt deep cycle marine battery that required recharging about every 36 hours of operation.
Figure 11--Graduate student Theresa Rademacker operates the seismograph and coordinates the acquisition from the enclosure on the back of the John Deere Gator 4 x 6 ATV.
As on previous surveys, the IVI minivib2 with the Atlas Rotary Servovalve provided the energy (Figure 12). The vibrator was guided from station to station using a customized computer mapping system incorporating DGPS technology with digital terrain maps. Five 10-second linear upsweeps were delivered at each shot station across a frequency bandwidth from 20 Hz to 250 Hz. The first sweep was designed to seat the pad thereby improving the uniformity in pad coupling and sweep consistency on the last four shots, which were vertically stacked to enhance signal strength relative to noise.
Figure 12--IVI minivib2 on station, immediately south of the CO2 injection well, and DGPS base station. Receiver line 3 crosses near the CO2 injection well where two Geodes also recorded 24 channels in each direction east and west from this central location.
The 14,000 lb vibrator was set to deliver a maximum of 12,500 lb-ft of power to the ground across the design frequency band. Ground force power plots are calculated from base plate and mass accelerometers and represent an estimate of the force being applied as a function of frequency (Figure 13). More than 6000 lb-ft was imparted to the ground across the 50 Hz to 200 Hz frequency range. Based on the these ground force plots the predominant frequency range on seismic reflection data should be between 45 Hz and 180 Hz with the dominant frequency around 90 Hz (Figure 13). For the most part this force curve is relatively smooth. Some minor "chatter" is evident between about 120 Hz and 180 Hz. This is an artifact of driving the vibrator at its limits through this range of frequencies.
Figure 13--Average force diagram for vibrator operations at the Russell County site for the IVI minivib2.
Continuous recording over time periods in excess of 15 hours resulted in a sustained production rate of around 15 shotpoints per hour. Downtime for mechanical or electronic failures never exceeded 30 minutes throughout that the acquisition period with just one exception. A servovalve failure near the end of the second night of recording required operations to be temporarily suspended for a period of four days while the vibrator was shipped to Tulsa, Oklahoma for repairs. Data acquisition was completed within an eleven-day window.
Windy conditions in central Kansas during late winter and early spring are the norm rather than the exception. With the winds diminishing in the evenings, at night, and in the early mornings, most data for this March 2005 survey were acquired during darkness (Figure 14). With vibrator routes preprogrammed in the DGPS guidance system, the vibrator operator could move the source from station to station and line to line without looking outside the cab. All routes were DGPS choreographed to sub-meter accuracy, allowing extreme precision in the track followed by the vibrator between surveys. Because of the necessity of recording data after dark, lighting on the vibrator was significantly enhanced over standard factory.
Figure 14--IVI minivib2 working in a field of winter wheat in total darkness. Auxiliary lighting has been installed on this machine providing an enhanced view of the mass and baseplate system as well as the ground around the vibrator cab.
As previously indicated, wind noise necessitated night operations. During the eleven-day field campaign production acquisition was only possible on four nights (due to wind and mechanical issues). Over those four nights the crew averaged about 200 shot stations per night. With the exception of a new and quite significant noise source (pumping oil wells within the receiver spread), the data quality was high and consistent with previous surveys.
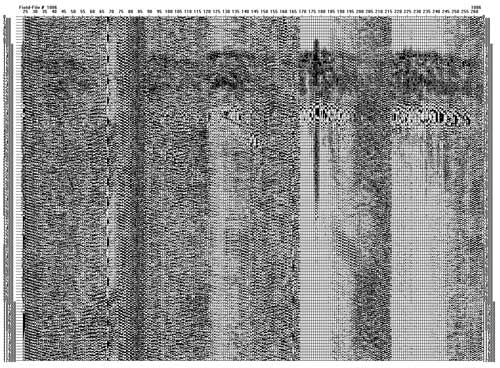
Noise from pumping oil wells within the receiver spread (oil wells that had been shut off during data acquisition on previous surveys) was extreme. Noise amplitudes on uncorrelated QC plots were at levels equivalent to those observed from 15+ mph winds on previous surveys (Figure 15). Correlated records from this survey possessed the most significant data quality problem so far during this monitoring program. These extremely elevated noise levels were the result of well operations and included both cyclic noise (pump cycle approx. 4 seconds to 6 seconds for a stroke) and a more random noise from motors powering the pump jacks. Five wells within the 1 square mile source grid that were shut down during acquisition of seismic data on previous surveys were pumping during the March 2005 survey.
Figure 15a--Uncorrelated shot records near center of patch recorded with seven production wells and four injection wells operating during March 2005 survey. A larger version of this figure is available.
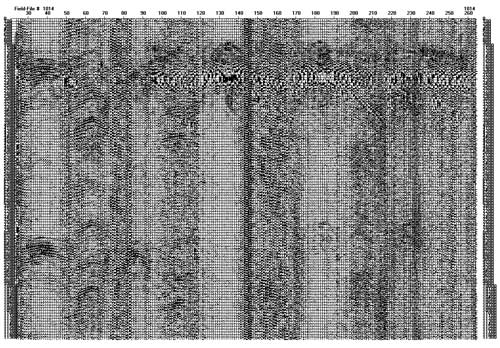
Figure 15b--Uncorrelated shot records near center of patch recorded with two production wells and three water injection wells operating during January 2004 survey. A larger version of this figure is available.
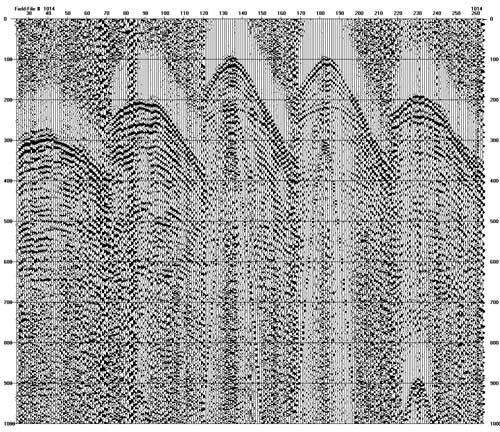
Reflections evident on correlated shot records possess characteristic hyperbolic curvature (Figure 16). The actual geometry of the reflection curves is related to the source-to-receiver offset of adjacent traces and the rate and linearity of the incremental change in that source-to-receiver offset between those adjacent traces. Signal-to-noise ratio is clearly lower on this single sweep shot gather than has been observed on gathers from previous surveys. Background noise is a more dominant component of these records, but even with the elevated noise levels resulting from pumping units, reflections with dominant frequency in excess of 70 Hz can be interpreted at depths in excess of 700 ms directly off these raw records.
Figure 16--Correlated, single-sweep shot gather from near the center of the patch. Background noise is much more pronounced on this record than has been the case on most gathers from previous surveys. Reflections are easily interpretable to depth in excess of 900 ms and offsets exceeding 3000 ft. A larger version of this figure is available.
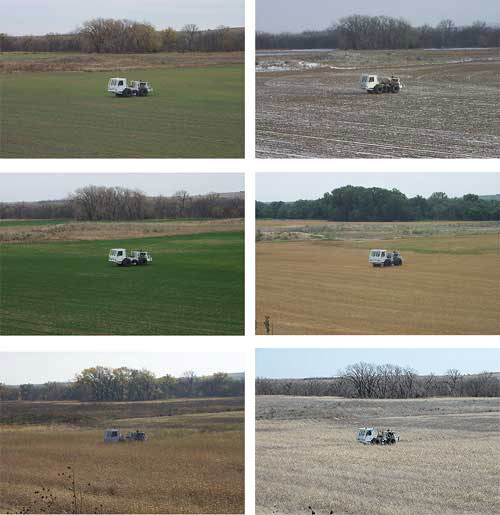
Changes in near-surface conditions and surface noise have impacted the recorded data in different ways on each of the six 3-D surveys completed over the last 18 months (Figure 17). Fortunately none of the changes in data quality and/or character has been sufficient or significant enough to surpass the expected and observed differences that have occurred as a result of fluid displacement with the reservoir. With changes in weather, surface noise, and ground conditions all playing supporting roles in the overall signal quality, it would be difficult to ascertain which seasonal influence enhanced or degraded the data quality and/or resolution the most.
Figure 17--View of vibrator when occupying station 19065 from the river terrace immediately north and slightly west of the vibrator. November 2003 survey (upper left), January 2004 survey (upper right), March 2004 survey (middle left), June 2004 survey (middle right), October 2004 survey (lower left), and March 2005 survey (lower right). Changes in seasons are noticeable but not dramatic.
Over 790 stations were recorded with less than 1% re-shoots necessary due to excessive wind or coupling issues. Data quality and acquisition rates were better than expected and bode well for consistency within the data set and to a lesser degree, because of the pump noise, with previous surveys.
|
Kansas Geological Survey, 4-D Seismic Monitoring of CO2 Injection Project Placed online April 14, 2005 Comments to webadmin@kgs.ku.edu The URL is HTTP://www.kgs.ku.edu/Geophysics/4Dseismic/Reports/March_2005/index.html |