|
|
|
|
July 2005 Site Visit--Sixth Monitoring Survey |
|
|
|||
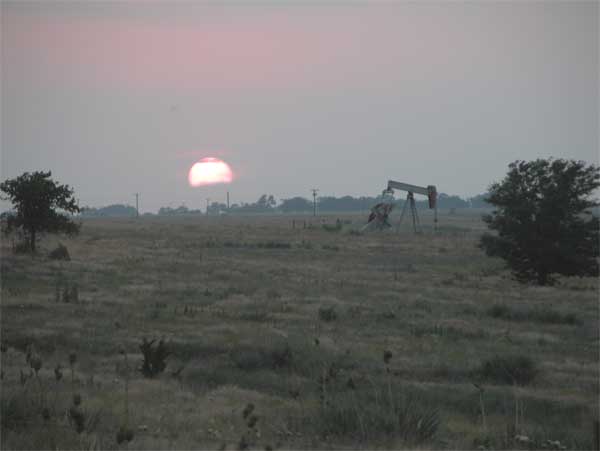
The first five monitor surveys were acquired during the first 16 months of this project while CO2 was being injected. The next and seismically more challenging component started on June 21, 2005, with initiation of water injection (Figure 1). The sixth 3-D survey was acquired during the first two weeks of July 2005.
Figure 1--Sun setting over the site with well 7 pumping in the background.
Processed data from all five monitor surveys give good indications that CO2 was imaged, reservoir heterogeneities are relatively consistent from one survey to the next, and images from each monitor survey show consistent expansion of the CO2 plume.
Data from the sixth monitor survey represent the last data acquired that might not be affected by the injection of water designed to chase the CO2 and, depending on how the water affects signal response, may be the last survey that provides a clear image of the complete CO2 plume. As water injection pressures change in the field, the saturations of the various components change. Less than two weeks of water injection separates the end of CO2 injection on June 20, 2005, and the acquisition of the sixth monitor survey in July 2005. Given the size of the horizontal sampling window at the reservoir depth and the volume of water injected, and the corresponding radius of water invasion, the influence of the injected water on seismic imaging of the CO2 plume at the time of the survey is considered negligible and limited to the single imaged pixel containing the CO2I#1 well.
Production Overview
Over the 18 months between start of CO2 injection on December 4, 2003, and the end of continuous CO2 injection and initiation of the first water injection on June 21, 2005, CO2 was generally injected at a rate of 2.5-3.0 gallons/minute (approx. 20 tons/day) at bottom-hole pressures of 1,800-1,900 psi. By June 21, 2005, approximately 8,500 tons of CO2 were injected into CO2I#1. The rate of oil production from wells 12 and 13 has averaged between 2.0 and 5.0 barrels/day since the beginning of 2005.
Site Conditions
With higher-than-average rainfall during the early part of the summer, the seismic acquisition characteristics, such as source and receiver coupling, near-surface attenuation, and unconfined water table depth, are much more conducive to the propagation of high-frequency seismic body waves than is normally observed during the month of July. As is normally the case in this part of the state of Kansas, the midday and afternoon/evening winds are challenging for high-quality, high signal-to-noise recording of the low-amplitude high-frequency signals necessary for high-resolution surveying. Unlike previous 3-D surveys over the past 18 months at this site, no attempt was made to record during the middle portion of the day or during afternoons. All data were recorded between 6:00 pm and 9:00 am. As has been clearly shown on previous surveys, the improvement in data quality is significant and justifies the additional acquisition expense.
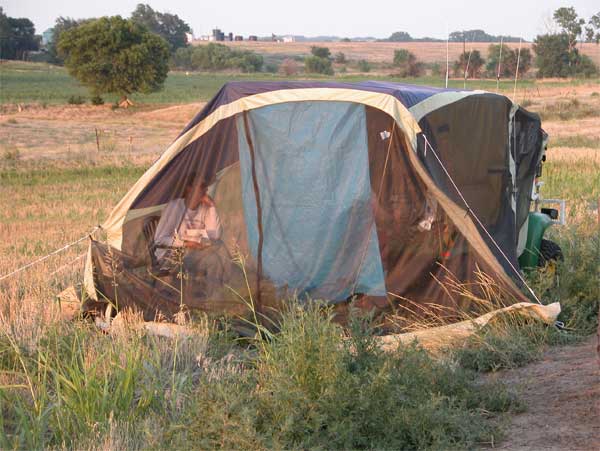
More rainfall also resulted in an increase in night-flying insects, which presented a problem for operating the seismograph at night. To avoid enclosing the seismograph operator and equipment, which would have involved climate control (air conditioner and generator) and increased noise, mosquito netting was draped over the seismograph vehicle (Figure 2). This kept the air temperature equivalent to the outside air, allowed a breeze at the operator station and across the equipment, and kept insects away.
Figure 2--Mosquito netting was draped over the seismograph vehicle to keep the air temperature equivalent to outside air, allow a breeze at the operator station and across the equipment, and keep insects away.
Data Acquisition
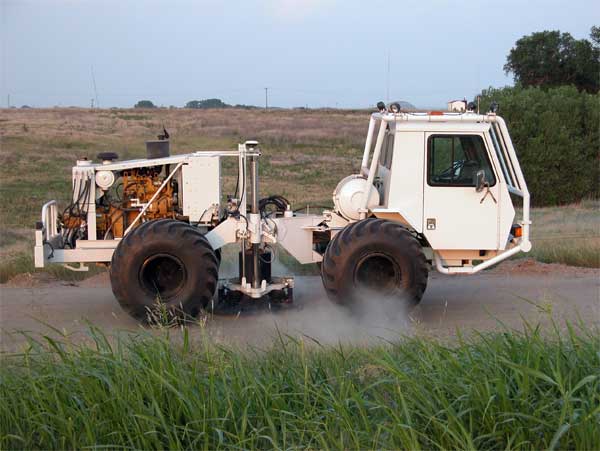
Data were acquired at over 790 shot stations with a location accuracy of better than 0.5 m (Figure 3). All receiver stations were deployed within 0.2 m of previous locations using DGPS. To avoid environmental noise, the data were acquired between 6:00 pm and 9:00 am over a 7-day window between July 7 and 13. For this survey, as with the March 2005 survey, the operator of the field was not in a position to shut down the peripheral pumping units during the seismic data acquisition and therefore noise from those pumps resulted in notable deterioration in signal-to-noise ratios on raw data.
Figure 3--Data were acquired at over 790 shot stations with a location accuracy better than 0.5 m. All receiver stations were deployed within 0.2 m of previous locations using DGPS.
Overall data quality was consistent with the five previous surveys. Ultra-near-surface conditions have changed with crop rotation and farming practices. These changes are noticeable on shot gathers from some areas. However, they are predominantly evident in subtle reductions in the amplitude of the higher portions of the reflection bandwidth. Balancing these frequencies reduces the spectral differences and to a limited extent reduces the signal-to-noise ratio. Fortunately, less than 20% of the survey area has seasonal crop rotation issues.
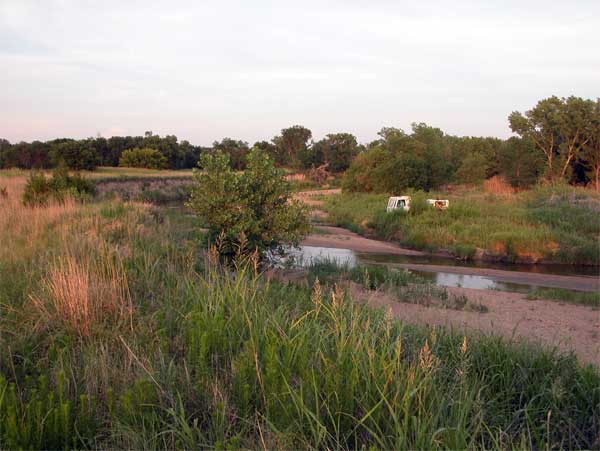
Data acquisition in most areas around the site has been consistent throughout the almost two years of recording (Figure 4). For the most part, the water table in the river valley areas of the site has been consistent, and stations with the highest data quality in seasonally consistent areas (not affected by farming practices) have routinely provided the highest quality data. It is likely these better-than-average data locations have stiffer soils, higher water tables, shallower bedrock, etc., relative to the other lower-quality areas around this site.
Figure 4--Data acquisition in most areas around the site has been consistent throughout the almost two years of recording.
|
Kansas Geological Survey, 4-D Seismic Monitoring of CO2 Injection Project Placed online Oct. 20, 2005 Comments to webadmin@kgs.ku.edu The URL is http://www.kgs.ku.edu/Geophysics/4Dseismic/Reports/July_2005/index.html |