|
|
|
|
Web Version of Proposal--Part 1 |
This proposal contains no proprietary information.
The objective of this research project is to acquire, process, and interpret multiple high-resolution 3-D compressional wave and 2-D, 2-C shear wave seismic data to observe changes in fluid characteristics in a oil field before, during, and after the miscible carbon dioxide (CO2) flood that is beginning in Spring 2003 as part of the DOE-sponsored Class Revisit Project (DOE #DE-AC26-00BC15124). Unique and key to this proposed imaging activity is the high-resolution nature of the seismic data, minimal deployment design, and the temporal sampling throughout the flood. The 900 m deep test reservoir is located in central Kansas oomoldic limestones of the Lansing-Kansas City Group, deposited on a shallow marine shelf in Pennsylvanian time (Watney, 1980, 1995).
Three-dimensional seismic delineation of the movement of a miscible CO2 floodbank through a petroleum reservoir allows identification of reservoir heterogeneity and in some situations their relationship to specific rock properties influencing sweep uniformity and the post-sweep distribution of CO2 in the reservoir. By spatially correlating key reservoir properties, such as porosity and permeability, with unique combinations of seismic attributes, reservoir simulation models can be optimally refined and the improved understanding of the on-going flood used to improve flood management and optimize performance. Questions such as: "Where is the injected CO2 going?" "What is the sweep efficiency?" "Are there any areas with bypassed oil?" "How can the injection and production program be improved in real time to optimize the sweep or recovery?" may be answerable while the enhanced recovery process is underway. Such questions need to be answered during the critical time between initially pressuring the reservoir with water and the eventual CO2 "breakthrough" at producing wells. In addition, questions concerning use of hydrocarbon reservoirs for carbon dioxide sequestration can be addressed. Questions such as: "Is CO2 moving outside the pattern?" "How does the CO2 in the reservoir change with time?" "Is CO2 migrating into overlying beds and how much is moving?" "Does seismic provide a viable monitoring tool for CO2 sequestration and containment?"
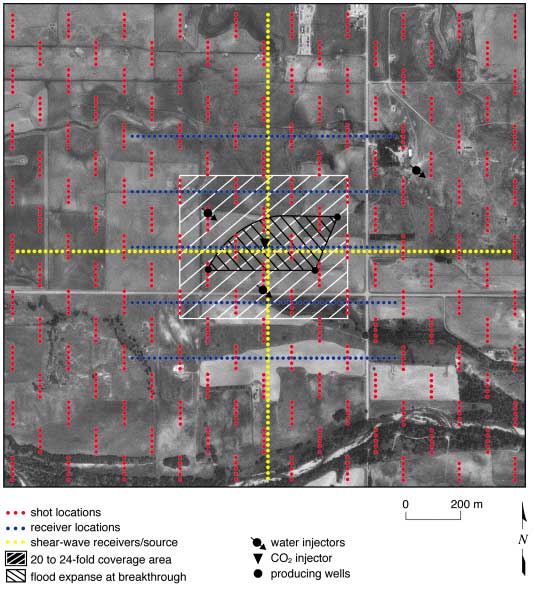
This 15-acre miscible CO2 flood involves three production wells, two water injectors, and one CO2 injector (Dubois et al., 2001) (Figure 1). The present reservoir simulation model for the flood area predicts slightly enhanced sweep to the #12 and #16 wells. Repeated 3-D seismic surveys may permit direct observation of the effectiveness of CO2 containment in the flood pattern area and the geometry of the front as it moves through the reservoir. Since the flood containment is influenced and, to some degree, controlled by injection rates in the #10 and #18, and production rates in the #12, #16, and #13, observations of unplanned movement may be controlled by altering injection and production rates. This seismic program will potentially provide a unique, extremely valuable real-time assessment of CO2 flood sweep and also an opportunity to evaluate reservoir model simulation performance at a resolution never before obtained.
Figure 1. Map showing 15-acre flood pattern for the DOE-sponsored CO2 miscible flood in the Hall-Gurney Field.
Using successive 3-D seismic surveys to monitor the progress of a flood front sweep through the reservoir will provide a detailed spatially and temporally continuous characterization (a true 4-D survey) that will permit progressive dynamic adjustments to the injection and production scheme. The 4-D survey also will provide a unique opportunity to investigate and assess dynamic flood schemes that try to compensate for non-uniform changes in fluid saturation and/or pressure. By incorporating successive seismically-based maps of lateral variation and fluid saturation and interpretations of permeability into the reservoir simulator, the injection scheme can be modified dynamically to achieve an optimal sweep of the oil reservoir. Without seismic monitoring, sweep effectiveness and reservoir heterogeneity cannot be assessed until "breakthrough," when the opportunity to perform fluid steering through modified injection and production schemes is more limited.
The viability of using seismic data to image and monitor CO2 containment is enhanced by the phase properties of CO2 for the conditions of this reservoir. In the flood pattern, the CO2 is at pressures generally greater than 1,100 to 1,400 psi. At these pressures, and at the existing reservoir temperature, the CO2 exhibits a density ranging from 0.3-0.7 g/cm3. If CO2 leaves the pattern area, either horizontally or vertically, it will decrease to pressures generally less than 700 psi. At these lower pressures the density of CO2 decreases substantially to below 0.1 g/cm3. At temperatures below 80ºF the CO2 enters a 2-phase region and exists as both a gas and a liquid. These marked changes in density would provide enhanced impedance contrast and consequently would elevate the seismic amplitude ("bright spot") response to the presence of CO2. In effect, CO2 leaving the pattern either horizontally or vertically into overlying beds is markedly more visible than CO2 in the pattern. Since production of this reservoir will be halted once the CO2 flood is complete, reservoir pressures will decrease and therefore CO2 densities will also decrease, enhancing the seismic signature and detectability of CO2 increase. Time-lapse seismic imaging will be extremely sensitive to any movement of physical changes in the CO2 remaining in the reservoir can be effectively monitored seismically to identify and characterize changes through time.
Evaluating optimal approaches of 4-D seismic as a suitable and cost-effective tool for routine monitoring of injection schemes on small, low-budget EOR projects and in lower yield, mature reservoirs is an important secondary goal of this project. Efficient sweeping of all oil from a reservoir and tracking and accounting for injected CO2 requires high-density spatial imaging of reservoir properties. Using real-time images of fluid and contaminant movement in reservoirs, dynamic injection and recovery schemes could be designed and continuously updated using reservoir simulations based on 4-D seismic data, existing well data, and new wells optimally located during flooding that dramatically increases the cost benefit of injection programs in mature and small fields.
For 4-D seismic to be economic on small floods and where multiple 3-D surveys within the injection and production periods will be necessary, the cost of data acquisition and processing must be minimized without compromising resolution. This cost cutting requires a nonconventional approach using low-cost seismic systems that produce extremely consistent, high-resolution data in a rapid fashion. The methodology must be of sufficiently high resolution to discretely resolve CO2 movement through very thin intervals and allow differentiation of CO2 that has moved outside the trapping formation.
The Lansing-Kansas City reservoir at the demonstration site is only 4 m thick with the most productive interval at the top of the reservoir being about 2 m thick, requiring dominant frequencies to exceed 150 Hz to resolve the top and bottom of the 4 m thick pay zone (Gochioco 1991; Miller et al., 1995). If these frequencies can be achieved and consistently recorded, the 4-D characterization of the reservoir at the necessary spatial scale for direct detection can be achieved. As well, if the CO2 moves outside the flood area, pressure drops and associated decreases in density will result in extreme amplitude anomalies (bright spots) that should be readily observable.
Time-lapse 3-D (or 4-D) seismic reflection profiling has been effectively used during the last decade (Ebrom et al., 1998), to monitor conventional enhanced oil recovery (EOR) programs (Huang et al., 1998; Rogno et al., 1999; Gabriels et al., 1999; Lumley, 1995). Maintaining consistency and repeatability in acquisition and processing has been the most persistently identified problem associated with time-lapse seismic monitoring of reservoir production (Huang and Will, 2000; Druzhinin and MacBeth, 2001; Meunier and Huguet, 1998; Nivlet et al., 2001; Li et al., 2001). Distinguishing between changes in seismic characteristics that result from temporal variation in near-surface properties and changes occurring in reservoir intervals as a result of flooding remains a significant problem. Cross-equalization techniques have proven to be a most effective tool in reducing the impact of near-surface variations on amplitude, phase, arrival time (static), and spectral properties (Huang and Will, 2000; Druzhinin and MacBeth, 2001; Meunier and Huguet, 1998). The potential of multiple (>2 per EOR or CO2 sequestration program) 3-D surveys to better differentiate changes in near-surface conditions from changes in reservoir fluids has not been evaluated.
To date, 3-D surveys monitoring changes in reservoir properties after the injection of miscible CO2 have consisted of a baseline survey and a post- or late-production survey only (Terrell et al., 2002; Acuna and Davis, 2001; Chapman et al., 2000; Harris et al., 1996). Such sparse sampling is inadequate to support true 4-D investigations. If only two surveys have been run in the time domain, all changes observed in the reservoir must be assumed to have occurred linearly, at a constant rate through both time and space. This is assuredly an oversimplification that may result in erroneous predictions. Even if the fluid phenomena being investigated behaved linearly in time and space (an unlikely circumstance), two time-slices would not permit assessment of the uncertainty in either the rate of change with time at fixed locations or the rate of spatial change between locations. At least four 3-D surveys, separated by time, are required to achieve the minimum degrees of freedom to assess temporal changes, and additional surveys will provide more detailed information.
EOR techniques must be developed to recover oil from the large number of Class II reservoirs in the mid-continent that retain bypassed or trapped oil after water flooding. As part of a "Class II Revisit" program funded by DOE, a 15-acre CO2 miscible flood pilot study has been designed to demonstrate the technical feasibility and economic viability of miscible EOR in a representative Lansing-Kansas City oomoldic limestone shallow-shelf carbonate reservoir. Details about this 6-year pilot project funded by the Department of Energy, Kansas Geological Survey, Tertiary Oil Recovery Project, KU Energy Research Center, MV Energy, Murfin Drilling Company, Kinder-Morgan CO2 Company, and the Kansas Department of Commerce & Housing are given at http://www.kgs.ku.edu/ERC/CO2Pilot/index.html.
Monitoring CO2 floods in carbonate reservoirs with conventional 3-D land seismic has been moderately successful within the last half decade (Harris et al., 1996; Brown et al., 2002; Duranti et al., 2000). The Reservoir Characterization Group (RCG) at Colorado School of Mines has studied and reported on two of the best known projects (Vacuum Field, New Mexico, and Weyburn Field, Saskatchewan). Anomalies in S-wave anisotropy and P-wave reflection amplitude, interpreted from time-lapse, multi-component, 3-D data and reservoir production data, correlate with fluid composition and pore pressure changes associated with CO2 injection programs (Duranti, 2001; Herawati, 2002). In both these studies a baseline survey was acquired with a follow-up survey acquired approximately one year later still during injection or mid-injection/ recovery. Those EOR projects provided key insight into the economics, efficiency, and information necessary for seismic monitoring of similar CO2 floods.
Preferential migration of CO2 within a producing zone, whether along fractures or associated with depositional features, appears to be mappable using seismic attributes and energy modes appropriate for the formation characteristics. Shear wave splitting and anisotropy appear sensitive to changes in stresses of fractured permeable reservoirs after CO2 injection (Cabrera-Garzón et al., 2000). In less permeable intervals (exhibiting lower fracture density) and below parting pressures, changes in compressional wave impedance volumes seem to be sensitive to and indicative of CO2 moving through the reservoir (Terrell et al., 2002). Lateral and vertical changes in fracture densities and orientations consistent with the local stress field were interpreted from observations of changes in shear wave anisotropy after the injection of CO2 at Vacuum Field in New Mexico (Pranter et al., 2000). Premature breakthrough at a producing well during the Weyburn Field EOR program studied by the RCG was interpreted from impedance volumes as "fingering" of the CO2 along more permeable channels (Brown et al., 2002). Neither field behavior was expected or predicted based on pre-flood data.
Unexpected spatial irregularities in reservoir characteristics revealed by 3-D seismic presented challenges at the CO2 flood of the Vacuum Field in New Mexico that required the development of a new reservoir model incorporating faults and fractures in the San Andres reservoir carbonates (Roche, 2000). A 4-D seismic survey showed faulting and fracturing previously not considered significant, as major influences on compartmentalization and non-uniform production of oil from this field.
The 4-D, 3-C monitoring of the Weyburn Field CO2 flood in the Williston Basin of Saskatchewan, Canada, revealed geologic and reservoir characteristics similar to what is expected at the Kansas Hall-Gurney Field demonstration site (Terrell et al., 2002; Herawati, 2002; Byrnes, 2000). Both fields are mature and have undergone extensive water flooding prior to CO2 floods. Both geologic settings can be characterized as shallow carbonate shelf deposits with pay zones averaging around 4 m thick, several cyclic intervals of varying thickness within the pay zone, and decreasing permeability and porosity from top to bottom of the producing zone. The best production intervals in each field possess relatively high permeabilities (over 100 md for the Weyburn Field and just over 200 md for the Hall-Gurney Field) and high porosities (about 38% for the Weyburn Field and 28% for Hall-Gurney Field).
Neither Hall-Gurney nor Weyburn fields have a dominant fracture component that would lend itself to tracking the movement of CO2 by observing changes in shear wave anisotropy and/or birefringence as was the case at Vacuum Field in New Mexico. Permeability in the Vacuum Field reservoir study can be characterized as predominantly fracture controlled. The Weyburn Field has some interaction between matrix porosity and fractures, but not nearly to the degree observed at Vacuum Field. There is no documentation indicating a relationship between porosity and fractures in the Hall-Gurney Field.
Contrasting these fields in this fashion and considering the seismic configuration that was most successful in tracking CO2 floods at Weyburn and Vacuum, it is reasonable to expect changes of 20% or more in 4-D compressional wave impedance volumes as the miscible bank moves across the pattern area during the first two years of the planned CO2 flood at Hall-Gurney (Terrell et al., 2002). However, as discovered at Vacuum Field, shear wave imaging has the potential to uncover unknown and unexpected reservoir characteristics (Davis and Benson, 2001). Findings from this seismic study of the Hall-Gurney CO2 injection project can be contrasted and compared with CO2 sequestration research currently active in association with the Weyburn storage and monitoring project (Pedersen et al., 2003; Khan and Rostron, 2003).
Dynamic seismic response due to reservoir production processes provides insights into the permeability structure of the reservoir (Talley et al., 1998). As seismic data track the CO2 front in three dimensions, lag areas can be identified and physical properties refined for these areas so that the model can be updated, thereby allowing the enhancement of reservoir simulation models and potentially, temporally tailored mid-flood adjustments can be made to the water injection and fluid production program.
CO2 sequestration in aquifers and depleted oil reservoirs, and residual CO2 remaining as a byproduct of oil recovery programs needs to be reliably monitored during injection and while dormant during storage (Guo et al., 2002; Bachu, 2001; Nihei et al., 2001). Currently pressure build-up and fall-off in wells is the most common method of monitoring CO2 injection (Benson, 2001). Movement of CO2 outside geologic traps is a major concern and obstacle to the acceptance and widespread use of CO2 sequestration (Guo et al., 2002). Time-lapse seismic is sensitive to changes in the imaged volume and could be quantified sufficiently to provide the necessary transport and fate assurances.
The inherent spatial resolution of a reflection seismic survey, even as dense a survey as the one proposed here, can be no greater than the spacing between subsurface sample points. This spacing is much larger than that required by a typical reservoir fluid-flow simulator, so the seismic data must be scaled down to match the simulator's requirements. Because the incorporation of successive surveys separated by time allows the use of prior information to refine subsequent estimates, a geostatistical procedure with Bayesian components is appropriate for decreasing the sampled volumes and thereby substantially increasing the number of sample points, an approach referred to as "Baysian maximum entropy" or BME estimation (Christakos, 2000).
Beyond its use for monitoring the upcoming CO2 flood at the Hall-Gurney Field demonstration site, high-resolution time-lapse 3-D seismic techniques need to be developed that are streamlined, focused, and cost effective in tracking the progress of any size flood (Houston and Kinsland, 1998) or monitoring subsurface CO2 sequestration sites. Conventional 3-D seismic has not proved to be a cost-effective tool for most operators trying to extend smaller fields or to capture trapped or stranded reserves on the flanks of or even within mature reservoirs. Conventional approaches to 3-D surveying will not likely meet the economic or resolution requirements of "routine" CO2 sequestration containment assurances (Bachu, 2001, Nihei et al., 2001; Hoversten et al., 2001). Innovative approaches to and adaptation of high-resolution seismic imaging will be necessary for seismic imaging to become the cost-effective tool necessary for monitoring CO2 floods or disposal.
Analyzing the effectiveness of sweep in real time allows minor adjustments to be made to injection pressures, volumes, and recovery/injection wells. These changes may reduce the duration of the flood, increase the uniformity of the flood, and improve the design of conformance control programs such as water-alternating-gas (WAG) programs.
Efficient design and implementation of 4-D monitoring of EOR programs could significantly increase the recovery of petroleum, especially from fields with marginally economic quantities of remaining oil in place. Of the original oil in place (OOIP), approximately 30-40% is trapped by water flooding and is subsequently only recoverable using an enhanced technology, such as CO2 miscible flooding. The remaining 60-70% of the OOIP is potentially recoverable, but in many reservoirs typically only 30% is produced even after EOR programs. The remaining 30% of potentially recoverable OOIP is either isolated from the wellbore by reservoir heterogeneity or bypassed as a result of the production program employed. These known but unrecovered reserves represent a significant potential asset (Nur, 1997).
The significant phase changes that CO2 will undergo if it leaves the high-pressure flood pattern either horizontally (into the lower-pressure surrounding area) or vertically (into overlying intervals), will increase the acoustic (reflectivity) contrast and therefore highlight any CO2 leaving the pattern. CO2 becomes progressively more seismically visible as the density drops, with the pressure gradient expected at the edge of the pattern the reflectivity will dramatically increase with minimal distance from the pattern. Any CO2 moving outside the pattern will be seismically detected as a high amplitude anomaly or bright spot. Testing and confirmation of this technology as an effective tool for monitoring CO2 sequestration may eventually provide the verification tool necessary for this application.
Extending compressional wave 3-D seismic imaging to include the two shear wave components provides additional information about rock properties but often comes at an unacceptably high cost. Data acquisition equipment and procedures unique to shear wave reflection seismology can increase the cost of a geophysics program from 2 to 10 times depending on the geology. The extra costs of processing (e.g., dependence and sensitivity) and acquiring (e.g., multi-component sources and receivers, double or tripling the number of recording channels) shear wave data and other technologically advanced and expensive aspects of a well-orchestrated 3-C monitoring program may exceed the cost benefit for most smaller fields in the U.S.
EOR programs in small, mature fields can be made cost effective by avoiding full 4-D, 3-C surveys. Seismic monitoring and development of scaled-down designs incorporating optimally designed time-lapse 3-D compressional surveys with smaller well-formulated and targeted 2-D, 2-C shear wave surveys can be effectively and efficiently used for mapping flood dynamics. Amplitude differencing of compressional wave volumes should be extremely diagnostic of CO2 escape into lower pressure units or CO2 moving outside the pressured reservoir, foregoing the need for shear wave imaging altogether on sequestration projects (Zweigel et al., 2001; Yuh et al., 2000).
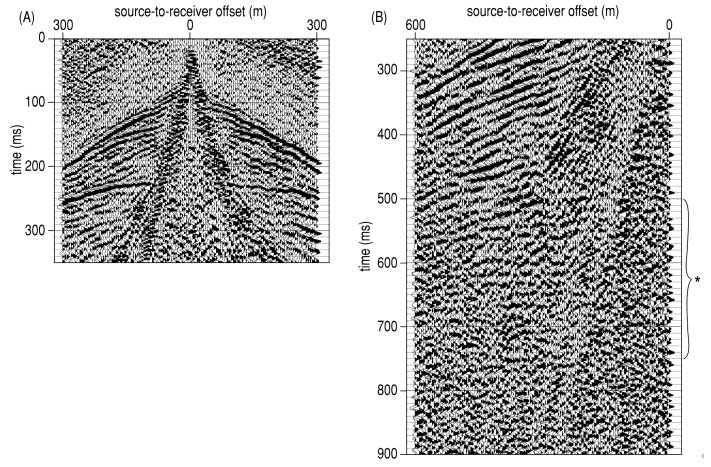
Successfully accomplishing some of the objectives/goals of this program is almost assured. Resolution potential, signal-to-noise, and penetration depths have already been estimated from walkaway tests previously conducted by the KGS at this site during the summer of 2002 (Figure 2). Test data were acquired under what is anticipated to be the worst near-surface and surface conditions that will be encountered at this site (extremely dry near-surface, all recovery wells pumping, moderate to high winds [50-60 km/hr gusts], and seismic lines parallel and beneath electric transmission lines).
Figure 2. Correlated and spectral balanced single sweep vibroseis shot gathers from the Hall-Gurney Field near Russell, Kansas. Upper 300 m have excellent high frequency reflection from Stone Corral Anhydrite (A). Reflections from the interval of interest* are around 600 ms (B). Wind and power line noise and extremely loose, dry surface make these the lowest quality records expected.
Improving recovery methods will extend the economic life of many reservoirs. A critical component for managing reservoir performance is offered by time-lapse seismology. If the use of repeated, three-dimensional, seismic surveys can delineate changes in bulk properties over time due to reservoir processes, then a multidisciplinary reservoir management team can estimate the pressures, saturation, and fluid movements within the permeability structure of the reservoir, thereby improving recovery performance and economics.
Contingent upon the successful completion of final negotiations between the partners of the CO2 pilot study at the Hall-Gurney Field, permits and access agreements must be secured for the 810 shot points and 240 receiver stations that make up the planned 3.6 km2 3-D deployment (Figure 3). Minor adjustments to spread and patch design will be necessary to optimize fold and azimuthal distribution for areas inaccessible or where landowner permission is not granted. Based on current reservoir simulations of the flood, the CO2 front will form a 15-acre pie-shaped pattern with the three producing wells at the corners and the CO2 injector well in the center. The current design provides uniform 20 to 24-fold coverage across an approximately 600 m x 450 m area centered on the flood pattern from start-up to breakthrough. Moving further away from the CO2 injector, the two water injection wells planned for containment are all within the minimum 12-fold boundary. The 2-D, 2-C shear wave lines will intersect near the injection well and extend about 750 m away from the injector. Even if the flood strays significantly from the current expected sweep pattern this 3-D design will provide the necessary offsets, offset distribution, azimuthal control, and fold to monitor the CO2 movement and eventual fate.
Figure 3. Orthophoto with preliminary 3-D survey design overlaying the wells involved with the CO2 injection program. The flood extent at breakthrough (indicated by black crosshatching) is fully within the uniform 20 to 24-fold area of the survey. These 810 shot stations and 240 receiver stations will be occupied twelve times in 4 1/2 years before, during, and after flood activities.
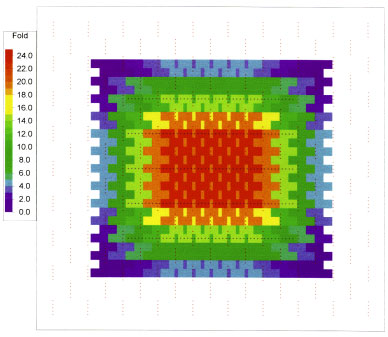
Initial patch designs have limited bin size to a maximum 10 m x 10 m area while maintaining uniform fold (Figure 4), offset (Figure 5), and azimuthal distributions (Figure 6 and Table 1). Shot lines are perpendicular to receiver lines and staggered to form a modified brick pattern. This pattern makes access and movement along shot lines precarious in some areas. This style patch does complicate the acquisition (source and receiver deployments), but it provides the optimum traces and trace distribution for each bin.
Figure 4. Foldmap with shot and receiver stations in the background. Dark green and blue areas (10 fold and less) define the migration aperture.
| Target depth | 910 m | |
| P-wave | S-wave | |
|---|---|---|
| Bin width | 10 m | |
| Bin length | 10 m | |
| Xmin | 694.3 m | 10 m |
| Xmax | 1705.7 m | 3.2 km |
| Receiver area | 1.0 km2 | |
| Shot area | 3.6 km2 | |
| Bin area | 2.0 km2 | |
| Number of receivers | 240 | 240 |
| Number of live receivers | 240 | 240 |
| Number of shot stations | 810 | 320 |
| Receiver station interval | 20 m | 20 m |
| Shot point interval | 20 m | 20 m |
| Receiver line interval | 200 m | |
| Shot line interval | 100 m | |
| Number of receiver lines | 5 | 2 |
| Number of shot lines | 19 | 2 |
| Number of receiver stations/line | 48 | 120 |
| Number of shot stations/line | 42.63 | 160 |
| Total length of receiver lines | 4.3 km | 4.8 km |
| Total length of shot lines | 27.6 km | |
A 240-channel Geometrics Strataview or 240-channel Geometrics Geode distributed system networked to a StrataVisor NZ acquisition controller will record the seismic data. Considering the offsets and power spectra of walkaway test data acquired in August 2002, a single IVI minivib with a one-of-a-kind prototype high-output Atlas rotary control valve sweeping 4 to 6 times at each source location should be optimal. Sweep frequencies for the P-wave survey will likely range from around 25 to 250 Hz with a 10 second duration. Receivers will be three digital grade 10 Hz Mark Products Ultra2w geophones wired in series with 14 cm oversized spikes. For each survey, geophones will be planted in a fresh spot but within a x m of the station location as defined during the initial survey. The three-geophone spread will form a 1 m equilateral triangle.
Shear wave data will be acquired with the same source (re-configured) and seismograph but with 14 Hz horizontal geophones and a sweep frequency ranging from around 15 to 150 Hz. Both shear wave lines (Figure 3) will be live (recorded) for all shear wave sweeps. The resulting data could be processed as 2-D or 3-D. In-field data analysis and preliminary processing in the KGS mobile processing facility will insure the highest quality data and quickest 3-D processing later at the KGS.
Accurate station surveying is essential for any 3-D seismic reflection program and critical for 4-D surveys. Integral to 4-D surveying is the demand for the utmost in accuracy and therefore repeatability of station locations. The 3.6 km2 survey grid proposed here will be located
absolutely using a Trimble survey-grade DGPS system. The same digital map will be used to exactly relocate each station for each of the repeat 3-D surveys. Data for each survey will be acquired uninterrupted during 48 hours of continuous operation. If production activity permits, the pump wells will be shut down during shooting of the seismic data to improve signal-to-noise (S/N) ratio.
Generation of a 3-D stacked cube ready for interpreting a month or so after collection will require a high-throughput commercial processing package such as the 2-D/3-D ProMax (a product of Landmark) processing package currently running at the KGS on a dual processor SGI Octane workstation. High-resolution (very short wavelengths) 3-D data will be necessary to have any chance of detecting the different layers within the pay zone at around 900 m. Optimally processing these 3-D data will involve techniques and algorithms developed for petroleum applications but carefully analyzed and applied in a fashion consistent with the needs of shorter wavelength and lower signal-to-noise ratio high-resolution data. Cross-equalization techniques will be evaluated and tailored to minimize or eliminate likely changes in wavelet characteristics, velocity, or statics from survey to survey associated with seasonal changes in near-surface conditions. Conventional seismic reflection technology (2-D and 3-D) is generally considered to be in the mature stages of its development, whereas high-resolution applications, especially in the area of 3-D acquisition and processing, are still in their infancy.
Interpretation of these seismic data will primarily involve difference analysis. Volumes including instantaneous frequency, amplitude, and phase along with impedance and coherency will be generated, compared, and differenced in search of the seismic attribute or attributes most sensitive to CO2 (fluid) movement in the reservoir. Industry experience confirms that empirical seismic attributes can be correlated with subsurface properties, and that attributes can be estimated using multivariate statistical procedures such as canonical correlation. Calculation of standard attributes and associated interpretations will be done using Kingdom Suites software. Time-to-depth conversions will be based on NMO velocity calculations and borehole sonic data. Animation of flood movement using attribute, synthetic, wiggle trace, and difference cubes will be developed and analyzed with the production of each seismic volume.
Enhancement of reservoir simulation performance will require development of 3-D volumes of geophysical properties for each cell. The first step in creating a model of the reservoir is to determine the multivariate three-dimensional semivariance, which expresses the rate-of-change with distance within the geophysical field. This is done by calculating experimental semivariograms independently for each geophysical property (e.g., impedance and amplitude) that will be mapped. From these semivariograms each cell as defined by the simulator model will be populated with the seismic properties and standard error.
The model is expanded by the introduction of time as an axis in 4-dimensional space-time with a series of cells having uniform temporal spacing. The most appropriate procedure for rescaling (or change of support, as the process is known in the geostatistical literature) involves geostatistical estimation and stochastic simulation (Christakos, 1992; Jeulin, 1994; Olea, 1999). These procedures have been applied mostly in either the time or the space dimension but can be extended to simultaneously include both time and space. The initial set of cells contain only naïve estimates because the data have only two temporal coordinates, but with the acquisition of a third and successive survey, rates-of-change with time can be estimated and used to refine the initial estimates.
Multiple qualitative and quantitative 3D models will be constructed to represent all reservoir characterization data at an appropriate range of realizations. These will both mirror and supplement the reservoir models developed as part of the demonstration project. Elements of the qualitative models will include nature of reservoir rocks, variability in reservoir quality, types, scales, and heterogeneity, reservoir architecture, definition and distribution of flow units, and nature of bedding and flow barriers. Elements of the 3D quantitative model will include grid block dimensions, porosity, effective permeabilities, compressibility, capillary pressure, and fluid properties. All data and models will be compiled in a database and visualized in 3D using one or more modeling software packages.
Reservoir simulation study at well and field levels will be carried out on the reservoir geomodels using PC-based reservoir simulator IMEX and using the compositional simulation module GEM (Computer Modeling Group Ltd., Calgary, Canada). A numerical approach that will be attempted will require correlation of seismic observations with synthetic seismograms produced from numerical reservoir simulator output, Gassmann's equations, and simple convolution (Huang et al., 1998). Discrepancies between the simulation output and data from each new 3-D seismic image of the flood will be addressed by refining the reservoir geomodels. Each refinement of the geomodel will be tested against the existing pressure and production history for the flood to insure that the model consistently predicts the history observed. The evolution of the model will be fully documented.
Refinement of both the reservoir simulation model and the seismic interpretation will be interactive. Refinement of the reservoir simulation model will provide new distributions of properties. These in turn will be used to evaluate the seismic results and modify analysis procedures. Feedback will occur throughout the project. In addition, both the seismic and reservoir simulation predictions of saturation changes will be correlated with reported injected and produced fluid volumes to assess the error in material balance between the methods.
Evaluation of the optimum methodology and procedures for monitoring movement and eventual fate of CO2 injected into this carbonate reservoir will be a major product.
At the conclusion of each phase a milestone is reached that represents a decision point for continuation of the project. Positive, successful findings and confidence in effectiveness of technologies will be necessary to move to the next phase. Detailed discussions and briefings with DOE representatives will represent the forum for making the decision to continue or abort the project.
Task 1--Finalize design survey
Task 2--Acquire/process baseline 3-D P-wave & 2-D S-wave after pressuring reservoir
Task 3--Develop synthetic from reservoir simulations
Task 4--First time-lapse 3-D compressional survey and correlation to predicted
Task 5--Second time-lapse 3-D compressional survey & Evaluate flood scheme
Tasks 6 & 7--repetitive cycle consistent with Tasks 4 and 5
Task 8--Fifth time lapse 3-D P-wave & evaluation of flood scheme & second 2-D, 2-C S-wave
Task 9--Sixth time-lapse 3-D compressional survey & flood evaluation
Tasks 10 & 11--repetitive cycle consistent with Task 9
Task 12--Evaluation of flood efficiency and detailed tracking of flood movement
Task 13--Ninth time-lapse 3-D compressional survey & flood evaluation
Task 14--Tenth time-lapse 3-D compressional survey & flood evaluation
Task 15--Eleventh time-lapse 3-D compressional survey & flood evaluation
Task 16--Evaluate sequestration component
Approaches, techniques, or methodologies developed in association with this study will be transferred to the industry through demonstrations, publications, and seminars. The web will serve not only as the interim reporting needs, but it will also act as a data and information resource for industry. Graphics with discussion of data examples at various stages of the acquisition and processing will be available as well as any code developed for unique problems or interpretations. Availability to cooperate on field demonstrations and assist with the design of optimum surveys for similar commercial applications will be an on-going activity. All data will be made available to any industry, government, academic, and research groups requesting it.
access limitations--redesign 3-D survey to compensate as best possible. The only question presently relates to surface access on the southeast, other surface ownership positions have been investigated and are favorable.
acquisition equipment malfunctions--equipment is in excellent shape, the minivib manufacturer is only 2 hours away, and spare seismographs will be on-site. Redundancy exists in all hardware two or three fold (rental vib ready to be on-site within hours, only SGI workstation without a redundant system, but contract service and repair local).
weather problems--weather delays are possible, shooting will only be in best conditions for the scheduled time of year and site access issues. All-weather equipment will be used.
processing difficulties--variability between processed sections not related to CO2 injection and cannot be compensated for using standard high-resolution processing flows. Post-stack cross-equalization and a variety of surface-consistent cross-equalization techniques will be used. At worst a delay in posting the findings will result.
hardware failures--redundant systems will be on-site for all hardware. Data will be stored on two different media and in two different places within hours of creation.
CO2 seismically undetectable--focus will shift to secondary goals such as optimization techniques for high-resolution imaging shallow reservoirs with very small profit margins.
data resolution or signal-to-noise limitations--focus on tracking CO2 through the entire 4 m pay zone as a single interval and look at indirect detection of the fluid changes.
non-unique reservoir simulation methods--reservoir simulations do not represent unique solutions modeling. The model(s) developed will honor all available data and variations in uncertainty.
Seismic system--Geometrics 240-channel R60 StrataView w/StrataVisor NZC for 240-channel Geode
Source--IVI Buggy minivib vibrator w/3.5 psi ground pressure (15-500 Hz, 10,000 lb peak force) with Atlas high-output rotational valve (prototype)
Geophones--Triple 10 Hz U2w & Double 40 Hz L28E both by Mark Products; GS-11D, 14 Hz horizontal, Geospace
Cables--Over 300 takeouts of seismic cable purchased within the last two years with over 2 km of pass cable
Field Processing Center--Semi truck with climate controlled processing center: Thermal printer, color plotter, three P4-class PCs, workstations for three staff, network to seismograph.
Other Supporting Software and Equipment
Field Support equipment--VHF radios (over a dozen handheld and vehicle mounts), Auto-line checker, Cable and geophone testing equipment, Complete set of spare parts for minivib, Generators, Surveying equipment (Trimble 4800 and 4700 differential GPS real-time sub 10 cm x,y,z), Cable adapters and jumpers, Bench grade seismograph analyzer, Tracked ATV's, three 6-wheel ATV's, portable shop with repair and maintenance capabilities, etc.
All equipment is transported to the site by KGS vehicles
Anderson, R.N., G. Guerin, W. He, and A. Boulanger, 1998, 4-D seismic reservoir simulation in a South Timbalier 295 turbidite reservoir: The Leading Edge, v. 17, n. 10, p. 1416-1418.
Bachu, S., 2001, Identification of best sites and means for CO2 sequestration in the Alberta Basin, Canada [Abs.]: Proceedings of the AAPG annual meeting, Denver, Colorado.
Benson, S., 2001, Effects of reservoir heterogeneity on pressure build-up and fall-off at CO2 injection wells [Abs.]: Proceedings of the AAPG annual meeting, Denver, Colorado.
Brown, L.T., T.L. Davis, and M. Batzle, 2002, Integration of rock physics, reservoir simulation, and time-lapse seismic data for reservoir characterization at Weyburn Field, Saskatchewan [Exp. Abs.]: Society of Exploration Geophysicists, p. 1708-1711.
Byrnes, A., 2000, Field demonstration of carbon dioxide miscible flooding in the Lansing-Kansas City formation, Central Kansas: ERC Update, August, p. 3.
Cabrera-Garzón, R., T.L. Davis, R.D. Benson, 2000, Time lapse shear wave anisotropy: A tool for dynamic reservoir characterization at Vacuum Field, New Mexico [Exp. Abs.]: Society of Exploration Geophysicists, p. 1540-1543.
Chapman, M., S. Zatsepin, and S. Crampin, 2000, Time-lapse seismic changes in a CO2 injection process in a fractured reservoir [Exp. Abs.]: Society of Exploration Geophysicists, p. 1536-1539.
Christakos, G., 1992, Random Field Models in Earth Sciences: Academic Press, Inc., San Diego, 473 p.
Christakos, G., 2000, Modern Spatiotemporal Geostatistics: Oxford Univ. Press, 288 p.
Davis, J.C., 2002, Statistics and Data Analysis in Geology, 3rd. ed.: John Wiley & Sons, New York, 638 p.
Davis, T.L., 2001, Monitoring production processes by 4-D multicomponent seismic surveys at Vacuum Field, New Mexico [Exp. Abs.]: Society of Exploration Geophysicists, p. 1616-1618.
Davis, T.L., and R.D. Benson, Monitoring production processes by 4-D multicomponent seismic surveys at Vacuum Field, New Mexico [Exp. Abs.]: Society of Exploration Geophysicists, p. 1616-1618.
Druzhinin, A., and C. MacBeth, 2001, Robust cross-equalization of 4D-4C PZ migrated data at Teal South [Exp. Abs.]: Society of Exploration Geophysicists, p. 1670-1673.
Dubois, M.K., A.P. Byrnes, and W.L. Watney. 2001, Field development and renewed reservoir characterization for CO2 flooding of the Hall-Gurney Field, central Kansas [Abs.]: Proceedings of the AAPG annual meeting, Denver, Colorado, v. 10, p. A53.
Duranti, L., 2001, Time lapse multicomponent seismic analysis of reservoir dynamics: Ph.D. dissertation, Colorado School of Mines, Golden, Colorado.
Duranti, L., T.L. Davis, and R.D. Benson, 2000, Time-lapse analysis and detection of fluid changes at Vacuum field, New Mexico [Exp. Abs.]: Society of Exploration Geophysicists, p. 1528-1531.
Ebrom, D., P. Krail, D. Ridyard, and L. Scott, 1998, 4-C/4-D at Teal South: The Leading Edge, v. 17, n. 10, p. 1450-1453.
Gabriels, P.W., N.A. Horvei, J.K. Koster, A. Onstein, A. Geo, and R. Staples, 1999, Time lapse seismic monitoring of the Draugen Field [Exp. Abs.]: Society of Exploration Geophysicists, p. 2035-2037.
Gochioco, L.M., 1991, Tuning effect and interference reflections from thin beds and coal seams: Geophysics, v. 56, p. 1288-1295.
Guo, Q., A.S. Abou-Sayed, and J.D. McLennan, 2002, CO2 geological sequestration engineering and economic challenges [Abs.]: Proceedings of the AAPG annual meeting, Houston, Texas.
Harris, J.M., R.T. Langan, T. Fasnacht, D. Melton, B. Smith, J. Sinton, and H. Tan, 1996, Experimental verification of seismic monitoring of CO2 injection in carbonate reservoirs [Exp. Abs.]: Society of Exploration Geophysicists, p. 1870-1872.
He, W., G. Guerin, R.N. Anderson, and U.T. Mello, 1998, Time-dependent reservoir characterization of the LF sand in the South Eugene Island 330 Field, Gulf of Mexico: The Leading Edge, v. 17, n. 10, p. 1434-1438.
Herawati, I., 2002, The use of time lapse P-wave impedance inversion to monitor a CO2 flood at Weyburn Field, Saskatchewan: Ph.D. dissertation, Colorado School of Mines, Golden, Colorado.
Houston, L.M., and G.L. Kinsland, 1998, Minimal-effort time-lapse seismic monitoring exploiting the relationship between acquisition and imaging in time-lapse data: The Leading Edge, v. 17, n. 10, p. 1440-1443.
Hoversten, G.M., E. Majer, T.M. Daley, 2001, Crosswell seismic and electromagnetic monitoring of CO2 sequestration [Abs.]: Proceedings of the AAPG annual meeting, Denver, Colorado.
Huang, X., and R. Will, 2000, Constraining time-lapse seismic analysis with production data [Exp. Abs.]: Society of Exploration Geophysicists, p. 1472-1476.
Huang, X, L. Meister, and R. Workman, 1998, Improving production history matching using time-lapse seismic data: The Leading Edge, v. 17, n. 10, p.1430-1433.
Jeulin, D., 1994, Change in scale in random media, in Dimitrakopoulos, R., ed.: Geostatistics for the Next Century, p. 235-244.
Johnston, D.H., R.S. McKenny, J. Verbeek, and J. Almond, 1998, Time-lapse seismic analysis of Fulmar Field: The Leading Edge, v. 17, n. 10, p. 1420-1428.
Johnston, D.H., J.J. Shyeh, J.E. Eastwood, M. Khan, and L.R. Stanley, 2000, Interpretation and modeling of time-lapse-seismic data: Lena Field, Gulf of Mexico: Proceedings of the 2000 Offshore Technology Conference, Houston, Texas, paper OTC 12132.
Khan, D.K., and B.J. Rostron, 2003, Regional fluid flow in the Weyburn CO2 project area: Implications for CO2 sequestration [Abs.]: Proceedings of the AAPG annual meeting, Salt Lake City, Utah.
Li, G., G. Purdue, S. Weber, and R. Couzen, 2001, Effective processing of nonrepeatable 4-D seismic data to minotir heavy oil SAGD steam flood, East Senlac, Saskatchewan, Canada: The Leading Edge, v. 20, n. 1, p. 54-63.
Lumley, D.E., 1995, 4-D seismic monitoring of an active steamflood [Exp. Abs.]: Society of Exploration Geophysicists, p. 203-206.
Lumley, D.E., A.G. Nunns, G. Delorme, A.A. Adeogba, and M.F. Bee, 2000, Meren Field, Nigeria: A 4D-seismic case study: Proceedings of the 2000 Offshore Technology Conference, Houston, Texas, paper OTC 12098.
Meunier, J. and F. Huguet, 1998, Céré-la-Ronde: A laboratory for time-lapse seismic monitoring in the Paris Basin: The Leading Edge, v. 17, n. 10, p. 1388-1394.
Miller, R.D., N.L. Anderson, H.R. Feldman, and E.K. Franseen, 1995, Vertical resolution of a seismic survey in stratigraphic sequences less than 100 m deep in Southeastern Kansas: Geophysics, v. 60, p. 423-430.
Nihei, K., L. Myer, Z. Liu, and L. Tomutsa, 2001, Seismic properties of partially-saturated sands with CO2 gas in the 1-9 kHz range [Abs.]: Proceedings of the AAPG annual meeting, Denver, Colorado.
Nivlet, P., F. Fournier, and J. Royer, 2001, A new methodology to account for uncertainties in 4-D seismic interpretation [Exp. Abs.]: Society of Exploration Geophysicists, p. 1644-1647.
Nur, A., 1997, Rock physics and 4-D seismic for improved oil recovery [Exp. Abs.]: Society of Exploration Geophysicists, p. 1009-1011.
Olea, R.A., 1999, Geostatistics for Engineers and Earth Scientists: Kluwer Academic Publishers, Boston, MA, 303 p.
Pedersen, P.K., S. Whittaker, J.E. Christopher, and M. Yurkowski, 2003, Characterizing secondary seals for geologic storage of CO2 in the Weyburn Field of the Williston Basin, Saskatchewan, Canada [Abs.]: Proceedings of the AAPG annual meeting, Salt Lake City, Utah.
Pranter, M.J., R. Cabrera-Garzón, J.J. Blaylock, T.L. Davis, and N.F. Hurley, 2000, Use of multicomponent seismic for the static reservoir characterization of the San Andres formation at Vacuum Field, New Mexico [Exp. Abs.]: Society of Exploration Geophysicists, p. 1548-1551.
Roche, S.L., 2000, Time-lapse, multicomponent, three-dimensional seismic characterization of a San Andres shallow shelf carbonate reservoir, Vacuum Field, Lea County, New Mexico: Masters thesis, Colorado School of Mines, Golden, Colorado.
Rogno, H., K. Duffaut, A.K. Furre, and L.B. Kvamme, 1999, Calibration of time lapse seismic to well and production data--Examples from the Statfjord Field [Exp. Abs.]: Euro. Soc. of Geosci. Eng., Session 5019.
Sigit, R., D. Satriana, J.P. Peifer, and A.L. Satrio, 1999, Seismically guided bypassed-oil identification in a mature steamflood area, Duri Field, Sumatra, Indonesia: Proceedings of the SPE Asia Pacific Improved Oil Recovery Conference, Kuala Lumpur, Malaysia, paper 57261.
Talley, D.J., T.L. Davis, R.D. Benson, and S.L. Roche, 1998, Dynamic reservoir characterization of Vacuum Field: The Leading Edge, v. 17, n. 10, p. 1396-1402.
Terrell, M.J., T.L. Davis, L. Brown, and R. Fuck, 2002, Seismic monitoring of a CO2 flood at Weyburn field, Saskatchewan, Canada: Demonstrating the robustness of time-lapse seismology [Exp. Abs.]: Society of Exploration Geophysicists, p. 1673-1675.
Watney, W.L., 1980, Cyclic sedimentation of the Lansing and Kansas City Groups (Missourian) in northwestern Kansas and southwestern Nebraska--A guide for petroleum exploration: Kansas Geological Survey, Bulletin 220, 72 p.
Watney, W.L., French, J.A., Doveton, J.H., Youle, J.C., and Guy, W.J., 1995, Cycle hierarchy and genetic stratigraphy of Middle and Upper Pennsylvanian strata in the upper Mid-Continent, in Hyne, N., ed., Sequence Stratigraphy in the Mid-Continent, Tulsa Geological Society, Special Publication #3, p. 141-192.
White, R.E., 1991, Properties of instantaneous seismic attributes: The Leading Edge, v. 10, n. 7, p. 26-32.
Yuh, S.H., S. Yoon, R.L. Gibson Jr., and A. Datta-Gupta, 2000, Effects of pressure and fluid saturation changes on time-lapse AVO response [Exp. Abs.]: Society of Exploration Geophysicists, p. 1481-1484.
Zweigel, P., R. Arts, T. Bidstrup, A. Chadwick, O. Eiken, U. Gregersen, M. Hamborg, P. Johanessen, G. Kirby, L. Kristensen, and E. Lindeberg, 2001, Results and experiences from the first industrial-scale underground CO2 sequestration case (Sleipner Field, North Sea): Proceedings of the AAPG annual meeting, Denver, Colorado, 7 p.
|
Kansas Geological Survey, 4-D Seismic Monitoring of CO2 Injection Project Placed online June 30, 2003 Comments to webadmin@kgs.ku.edu The URL is HTTP://www.kgs.ku.edu/Geophysics/4Dseismic/Reports/CO2prop-pt1.html |