|
|
|
|
Progress Report on Preliminary Processing and Interpretation of the Fourth Monitor Survey (October 2004) |
|
|
|||
Preliminary interpretation of the October 2004 3-D survey suggests increased "fingering" in the CO2 migration (Figure 1). Considering the lateral resolution of these data, small objects (sub-wavelength) will be smeared to appear much larger. Therefore a narrow higher permeability zone may possess a seismic signature several times larger that the actual affected area. With that in mind, the fingers from the main CO2 body may be representative of regions that are several times smaller than they appear on the amplitude attribute data. These finger-like features have all the necessary characteristics to suggest this seismic response is based on changes in fluid composition.
Figure 1--Amplitude envelope attribute for a very preliminary processed October 2005 survey. Fingering is becoming much more pronounced with the general trend of those accelerated migration paths consistent with the secondary lineament orientations previously identified.
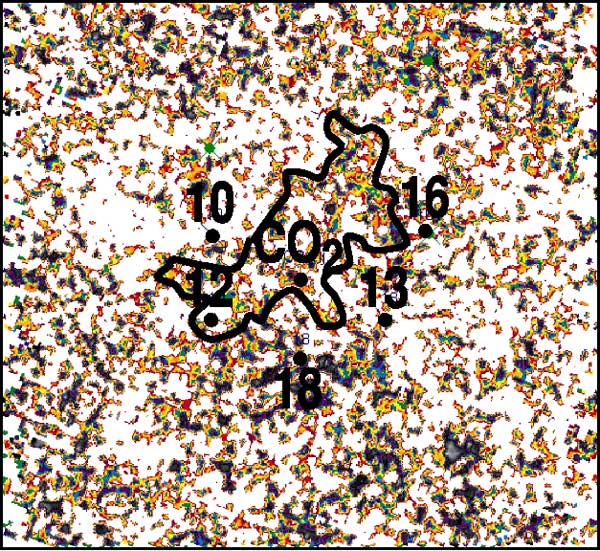
One obvious consideration is the volumetrics of a feature this large and the apparent growth since the June 2004 survey. Basic volumetric balance with injected CO2 and the CO2 area shown by seismic requires that the defined area of CO2 represent movement of CO2 in a thin interval and not through the entire C-zone pay section. Volumetrics would also support the interpretation that the fingers may be narrower than they appear on the seismic data.
Overlaying the four monitor surveys is preliminary due to how early the October 2004 data are in the processing phase (Figure 2).
Figure 2--Overlay of monitor survey 1 (M1), monitor survey 2 (M2), monitor survey 3 (M3), and monitor survey 4 (M4). Apparent fingering along the secondary lineament orientations is quite pronounced.
Interpretation of the areal pattern change can be interpreted to show that growth toward well #13 appears to be accelerating between June 2004 and October 2004, but the path of the CO2 is not direct. If this interpretation is correct and movement toward well #13 is following narrow, directed pathways, then gradual breakthrough might be anticipated as exhibited by field production.
Small concentrations of CO2 began to appear in well #13 at very low levels (0.49%) in August 2004, but may have represented pre-flood natural CO2 in reservoir water. By October 2004, CO2 concentration had increased (3.09% of total gas) but was still below levels suggesting breakthrough. In December 2004, CO2 concentrations increased to 6.44%, suggesting limited breakthrough had occurred. With low production and delay in oil or gas arrival at well #13, the field operations team decided that well stimulation should be performed. A process known as Huff-n-Puff (injection of CO2 directly into well #13 to modify the relative permeability around the well) was initiated. Following this treatment, concentrations of CO2 are no longer reliable measures of the progression of the main CO2 body.
This gradual increase in concentration of CO2 in well #13 is consistent with a possible fingering scenario. The seismically mapped progression of CO2 between CO2I#1 and well #12 exhibited a more uniform flood front, consistent with the observed increase in CO2 concentrations in well #12. The different response in well #13 suggests either a different migration pattern and/or migration mechanism at work between CO2I#1 and well #13.
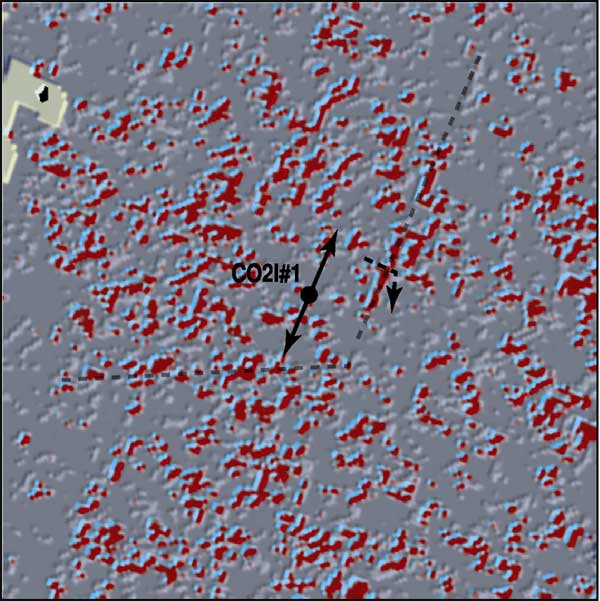
Comparing the interpretation of the preliminary processed October 2004 survey with the seismic lineament attribute map, the general trends of the fingering and main body is still consistent with the interpreted "barriers" associated with the major lineaments (Figure 3). One of the more interesting observations is the location where the CO2 appears to have moved east through this northeast/southwest "barrier." Looking at the lineament attribute map only (Figure 4), this location exhibits anomalous seismic response along an otherwise relatively continuous expanse of this feature. Considering the pressure field established around well #13, once the CO2 has moved through this "barrier" it should move more quickly toward #13. If this interpretation is correct, the volume of CO2 moving to well #13 may be controlled by the nature of the "break" in the possible barrier.
Figure 3--October 2004 survey amplitude envelope attribute map with interpretations of the CO2 "front" overlain by the lineament attribute map.
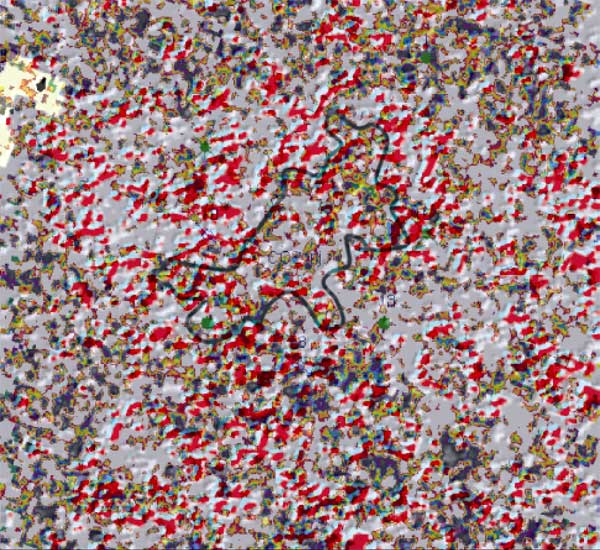
Figure 4--Major lineaments that appear to be influencing fluid movement away from CO2I#1, including the possible route the CO2 took to breech the barrier associated with the northeast/ southwest lineament.
This preliminary interpretation of the October 2004 (Figure 1) data will be further examined with processing and interpretation. Throughout the pilot study it has been known that #13 response to injection in CO2I#1 was complex and potentially indicative of some form of restriction between wells CO2I#1 and #13. The present interpretation of the 4D seismic data would support this conclusion.
|
Kansas Geological Survey, 4-D Seismic Monitoring of CO2 Injection Project Placed online April 18, 2005 Comments to webadmin@kgs.ku.edu The URL is HTTP://www.kgs.ku.edu/Geophysics/4Dseismic/Process/Oct_2004/index.html |