|
|
|
|
Data Processing Update--August 2005 |
|
|
|||
Based on the results of the first year of seismic monitoring of the CO2 injection process, results suggest that seismic reflection methods have been effective at providing data that can be used to image the movement of CO2 across this 3000-ft-deep, 15-ft-thick reservoir interval. Based on present processing and interpretation methods, CO2 movement is best imaged by extremely low amplitude changes in the amplitude envelope attribute and subtle variations in instantaneous frequency.
To extract as much information as possible from the data, stacked sections must be produced that fully capture and enhance the relevant information content of the data. The focus of this enhancement activity is on coherency, signal-to-noise ratio, and resolution. Stacked sections produced to date have been preliminary and intended to satisfy the need for quick turnaround at the expense of identifying the best processing and interpretation methods. The rapid development of interpreted seismic sections was necessary to provide seismic imaging of the flood for the on-going CO2 flood management. Dynamic adjustment to injection and withdrawal management and flood design is likely to be a future application of the method as an EOR monitoring/evaluation tool.
To enhance the image quality for interpretation and image resolution, several aspects of data processing must be addressed. Enhancement of coherency can be achieved by improving uniformity of source wavelet properties and statics. In addition, optimized velocity corrections can improve wavelet consistency from trace to trace. Signal-to-noise ratio is always an important characteristic when dealing with high-resolution seismic reflection data. Improvements in signal-to-noise ratio require optimizing the frequency bandwidth, ensuring consistency in phase, elimination of as much noise through muting and filtering as possible, and pre-stack statics. Finally, to extract the highest resolution interpretations possible, the upper corner reflection frequency must be identified and the focus of spectral shaping (keeping in mind the need for a broad bandwidth) must be determined, as well as resolving statics issues and balancing amplitude characteristics.
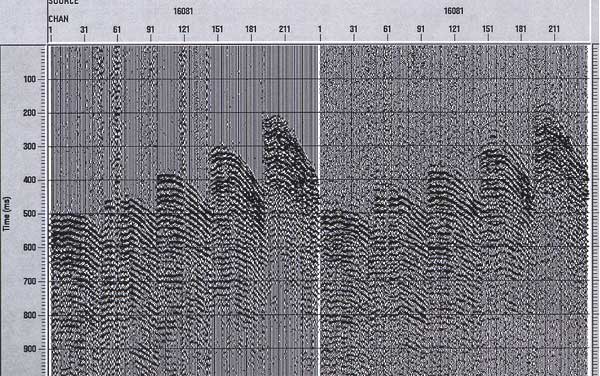
Enhancement processing began midway through the second year of the program. All data will undergo the optimized enhancement flow in a consistent fashion. Initial analysis suggests phase correction pre-correlation and pre-vertical stacking results in a better than 20% increase in bandwidth and in data coherency (Figure 1). Spiking deconvolution improved the reflection bandwidth and provides improved wavelet characteristics, but decreases the apparent signal-to-noise ratio. This is a tradeoff that is necessary and turns out to be all positive based on downstream processing.
Figure 1--Raw correlated shot gather (right) compared to the same shot gather after phase filtering and spiking deconvolution shot gather (left). A larger version of this figure is available.
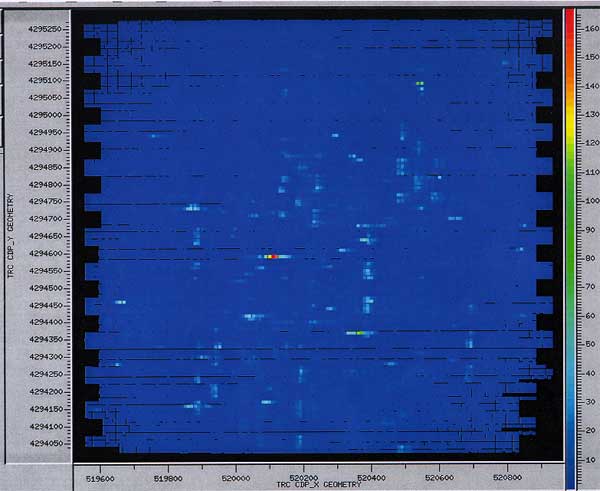
Amplitude attributes provide important information about where CO2 is present within the pattern. Based on the acquisition design, the amplitude distribution within the grid has natural artifacts associated with the pattern (Figure 2). Correction to this non-uniform distribution in amplitudes will eliminate the shadows evident on the amplitude envelope attribute consistent with the receiver grid. After amplitude distribution corrections only minor linear artifacts remain, predominantly inline and crossline to the imaged space (Figure 3).
Figure 2--Seismic trace Root mean squared amplitude map before surface consistent amplitude balancing.
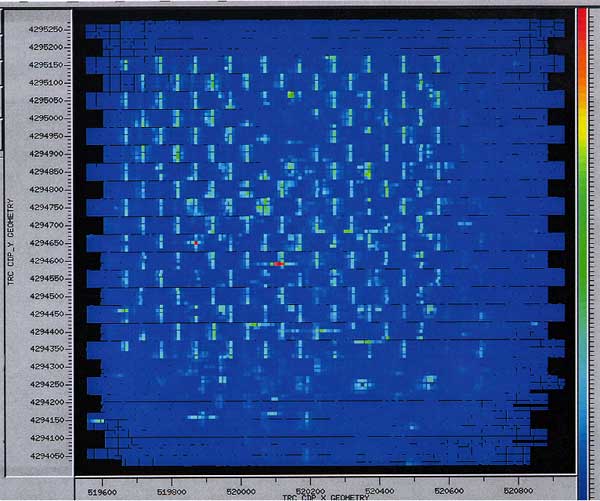
Figure 3--Seismic trace Root mean squared amplitude map after surface consistent amplitude balancing; acquisition footprints have been largely eradicated.
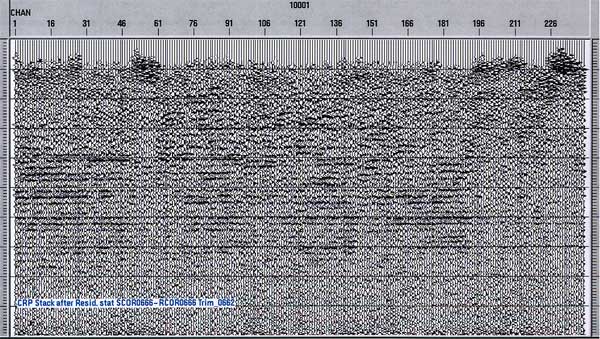
During preliminary processing, source and receiver statics were corrected for using surface-consistent correlation statics routines (Figure 4). These corrections were adequate for general stacked sections, but lack the station-specific accuracy necessary for high quality image construction. After the application of residual statics focusing on a 500-msec window surrounding the target reflection, a significant improvement can be noted in the coherency of the unstacked, moved-out shot gather (Figure 5).
Figure 4--Common-shot-point stacked seismic data after surface-consistent correlation statics but before residual statics. A larger version of this figure is available.
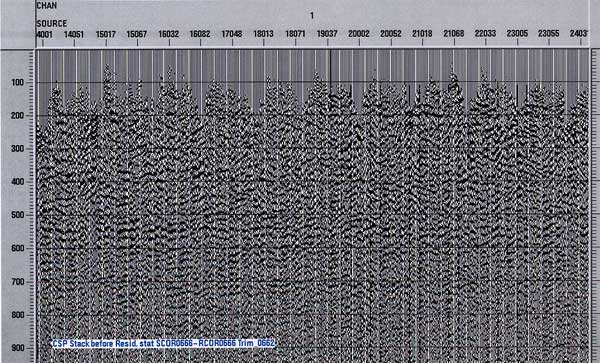
Figure 5--Common-shot-point stacked seismic data after both surface-consistent correlation statics and residual statics. A larger version of this figure is available.
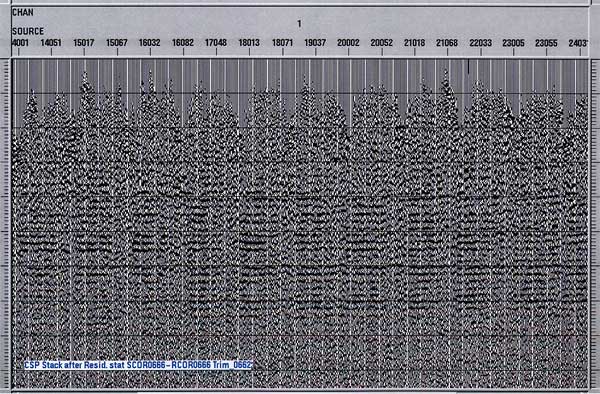
After gathering the data into common receiver bins, and applying residual statics in a fashion consistent with application of the same statics routine on common shot gathers, reflection coherency improves dramatically and the spectral (therefore resolution) also makes a marked improvement. Common receiver stacks possess good signal-to-noise ratios but lack the sitewide coherence and consistency in arrivals indicative of a section with all near-surface effects removed (Figure 6). In the middle of the seismic volume, the data are higher amplitude and seem to possess better shallow continuity in comparison to the lower-fold data near the ends of the spread. This is consistent with the CMP stacked volumes interpreted during the preliminary stages of processing. After a residual statics operation was applied to the receiver gathers, problems associated with coherency, bandwidth, and amplitude all seem to dramatically reduce (Figure 7). The pre-residual statics data are the same data that were used to produce the stacked volumes that were interpreted and suggestive of differences related to the presence of CO2.
Figure 6--Common-receiver-point stacked seismic data after surface-consistent correlation statics but before residual statics. A larger version of this figure is available.
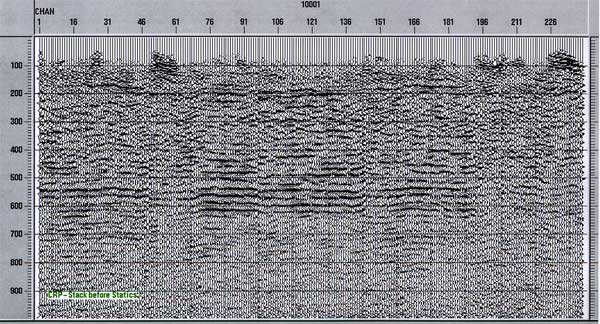
Figure 7--Common-receiver-point stacked seismic data after both surface-consistent correlation statics and residual statics. A larger version of this figure is available.
|
Kansas Geological Survey, 4-D Seismic Monitoring of CO2 Injection Project Placed online Oct. 20, 2005 Comments to webadmin@kgs.ku.edu The URL is http://www.kgs.ku.edu/Geophysics/4Dseismic/Process/Aug_2005/index.html |