![]()
Prev Page--Recovery and Utilization || Next Page--Formations
Ground Water, continued
Chemical Character of Ground Water
The chemical character of ground water in Sherman County is shown by analyses of water from 24 representative wells (Table 7). Figure 12 shows graphically the chemical character of water from the Ogallala formation, alluvium, and Pierre shale. The samples were analyzed by Howard A. Stoltenberg, chemist, in the Water and Sewage Laboratory of the Kansas State Board of Health at Lawrence. The analyses show only the dissolved mineral content and do not indicate the sanitary condition of the water.
Fig. 12--Chemical analyses of water from wells in Sherman County.
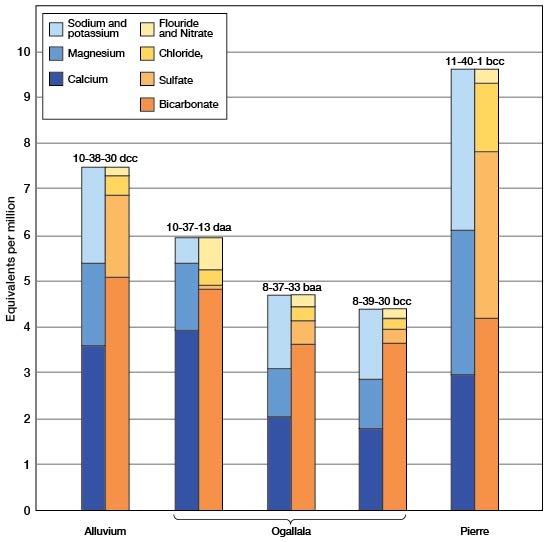
Table 7--Analyses of water from typical wells in Sherman County. Analyzed by H. A. Stoltenberg. Dissolved constituents given in parts per milliona, and in equivalents per millionb (in italics).
| Well Number |
Depth (feet) |
Geologic source |
Date of collection, 1949 |
Temp. (°F) |
Dissolved solids |
Silica (SiO2) |
Iron (Fe) |
Calcium (Ca) |
Magnesium (Mg) |
Sodium and potassium (Na+K) |
Bicarbonate (HCO3) |
Sulfate (SO4) |
Chloride (Cl) |
Fluoride (F) |
Nitrate (NO3) |
Hardness as CaCO3 | ||
|---|---|---|---|---|---|---|---|---|---|---|---|---|---|---|---|---|---|---|
| Total | Carbonate | Non- carbonate |
||||||||||||||||
| T. 6 S., R. 37 W. | ||||||||||||||||||
| 6-37-11bc | 195.0 | Ogallala | Oct. 26 | 268 | 24 | 5.4 | 37 1.85 |
16 1.32 |
36 1.57 |
229 3.76 |
26 0.54 |
11 0.31 |
1.8 0.09 |
2.8 0.04 |
158 | 158 | 0 | |
| T. 6 S., R. 38 W. | ||||||||||||||||||
| 6-38-34cbb | 152.0 | Ogallala | Oct. 26 | 58 | 275 | 38 | 0.05 | 37 1.85 |
16 1.32 |
33 1.42 |
222 3.64 |
19 0.40 |
11 0.31 |
1.2 0.06 |
11 0.18 |
158 | 158 | 0 |
| T. 6 S., R. 39 W. | ||||||||||||||||||
| 6-39-6dda | 160.0 | Ogallala | Oct. 26 | 57 | 285 | 44 | 1.1 | 39 1.95 |
16 1.32 |
30 1.29 |
205 3.36 |
30 0.62 |
10 0.28 |
1.8 0.09 |
13 0.21 |
164 | 164 | 0 |
| T. 6 S., R. 41 W. | ||||||||||||||||||
| 6-41-9bcb | 205.0 | Ogallala | Oct. 26 | 58 | 279 | 42 | 1.1 | 32 1.60 |
15 1.23 |
40 1.74 |
222 3.64 |
20 0.42 |
9.0 0.25 |
2.0 0.10 |
10 0.16 |
142 | 142 | 0 |
| T. 6 S., R. 42 W. | ||||||||||||||||||
| 6-42-4aac | 167.5 | Ogallala | Oct. 26 | 57 | 271 | 53 | 0.06 | 44 2.20 |
16 1.32 |
17 0.73 |
200 3.28 |
19 0.40 |
11 0.31 |
1.5 0.08 |
11 0.18 |
176 | 164 | 12 |
| T. 7 S., R. 38 W. | ||||||||||||||||||
| 7-38-36ada | 144.5 | Ogallala | Oct. 29 | 58 | 288 | 46 | 1.1 | 41 2.05 |
14 1.15 |
34 1.46 |
227 3.72 |
18 0.37 |
11 0.31 |
1.5 0.08 |
11 0.18 |
160 | 160 | 0 |
| T. 7 S., R. 39 W. | ||||||||||||||||||
| 7-39-35add | 164.8 | Ogallala | Oct. 29 | 58 | 282 | 49 | 1.8 | 34 1.70 |
14 1.15 |
38 1.65 |
221 3.62 |
17 0.35 |
10 0.28 |
1.8 0.09 |
9.7 0.16 |
142 | 142 | 0 |
| T. 7 S., R. 41 W. | ||||||||||||||||||
| 7-41-28aad | 106.0 | Ogallala | Oct. 26 | 58 | 254 | 38 | 0.76 | 38 1.90 |
13 1.07 |
27 1.18 |
198 3.25 |
20 0.42 |
10 0.28 |
1.2 0.06 |
8.8 0.14 |
148 | 148 | 0 |
| T. 7 S., R. 42 W. | ||||||||||||||||||
| 7-42-10cbb | 128.5 | Ogallala | Oct. 26 | 57 | 266 | 42 | 0.48 | 42 2.10 |
18 1.48 |
20 0.89 |
232 3.80 |
12 0.25 |
8.5 0.24 |
1.0 0.05 |
8.0 0.13 |
179 | 179 | 0 |
| T. 8 S., R. 37 W. | ||||||||||||||||||
| 8-37-33baa | 125.0 | Ogallala | Oct. 29 | 57 | 279 | 32 | 0.10 | 41 2.05 |
13 1.07 |
36 1.58 |
222 3.64 |
24 0.50 |
11 0.31 |
1.2 0.06 |
12 0.19 |
156 | 156 | 0 |
| T. 8 S., R. 39 W. | ||||||||||||||||||
| 8-39-3cbc | 151.5 | Ogallala | Oct. 29 | 58 | 273 | 46 | 0.51 | 37 1.85 |
17 1.40 |
28 1.20 |
223 3.66 |
16 0.33 |
8.0 0.23 |
1.6 0.08 |
9.3 0.15 |
162 | 162 | 0 |
| 8-39-15ccc | 254.0 | Ogallala | Oct. 28 | 57 | 276 | 40 | 1.3 | 35 1.75 |
12 0.99 |
40 1.73 |
215 3.53 |
20 0.42 |
9.0 0.25 |
1.6 0.08 |
12 0.19 |
137 | 137 | 0 |
| 8-39-30bcc | 165.5 | Ogallala | Oct. 31 | 259 | 32 | 0.12 | 36 1.80 |
13 1.07 |
35 1.53 |
222 3.64 |
16 0.33 |
8.5 0.24 |
1.0 0.05 |
8.8 0.14 |
144 | 144 | 0 | |
| T. 8 S., R. 41 W. | ||||||||||||||||||
| 8-41-22cbb | 175.0 | Ogallala | Oct. 26 | 59 | 267 | 36 | 0.05 | 32 1.60 |
15 1.23 |
37 1.63 |
214 3.51 |
21 0.44 |
10 0.28 |
1.8 0.09 |
8.8 0.14 |
142 | 142 | 0 |
| T. 9 S., R. 37 W. | ||||||||||||||||||
| 9-37-30dad | 174.5 | Ogallala | Oct. 29 | 59 | 278 | 25 | 0.64 | 35 1.75 |
15 1.23 |
43 1.86 |
232 3.80 |
23 0.48 |
12 0.34 |
1.3 0.07 |
9.3 0.15 |
149 | 149 | 0 |
| T. 9 S., R. 38 W. | ||||||||||||||||||
| 9-38-5dcc | 136.5 | Ogallala | Oct. 29 | 57 | 263 | 17 | 1.4 | 42 2.10 |
12 0.99 |
32 1.41 |
212 3.48 |
22 0.46 |
11 0.31 |
1.1 0.06 |
12 0.19 |
154 | 154 | 0 |
| T. 9 S., R. 42 W. | ||||||||||||||||||
| 9-42-2cbb | 80.0 | Ogallala | Oct. 26 | 57 | 266 | 34 | 1.5 | 38 1.90 |
15 1.23 |
32 1.37 |
224 3.67 |
15 0.31 |
8.5 0.24 |
1.7 0.09 |
12 0.19 |
156 | 156 | 0 |
| T. 10 S., R. 37 W. | ||||||||||||||||||
| 10-37-13daa | 168.5 | Ogallala | Oct. 29 | 57 | 331 | 20 | 0.24 | 79 3.94 |
18 1.48 |
12 0.53 |
205 4.84 |
4.1 0.08 |
12 0.34 |
1.0 0.05 |
40 0.64 |
271 | 242 | 29 |
| T. 10 S., R. 38 W. | ||||||||||||||||||
| 10-38-19ccc | 48.5 | Ogallala | Oct. 29 | 57 | 294 | 20 | 0.13 | 48 2.40 |
14 1.15 |
37 1.61 |
234 3.84 |
31 0.64 |
15 0.42 |
1.0 0.05 |
13 0.21 |
178 | 178 | 0 |
| 10-38-30dcc | 23.5 | Alluvium | Oct. 29 | 55 | 436 | 32 | 0.10 | 72 3.59 |
22 1.81 |
48 2.08 |
311 5.10 |
86 1.79 |
15 0.42 |
0.9 0.05 |
7.5 0.12 |
270 | 255 | 15 |
| T. 10 S., R. 39 W. | ||||||||||||||||||
| 10-39-8bcc | 24.0 | Ogallala | Oct. 31 | 56 | 272 | 16 | 0.18 | 42 2.10 |
13 1.07 |
37 1.63 |
212 3.48 |
34 0.71 |
12 0.34 |
1.2 0.06 |
13 0.21 |
158 | 158 | 0 |
| T. 10 S., R. 41 W. | ||||||||||||||||||
| 10-41-26ccc | 91.0 | Ogallala | Oct. 31 | 224 | 15 | 0.14 | 36 1.80 |
11 0.90 |
30 1.31 |
198 3.25 |
12 0.25 |
9.0 0.25 |
1.6 0.08 |
11 0.18 |
135 | 135 | 0 | |
| T, 10 S., R. 42 W. | ||||||||||||||||||
| 10-42-9bba | 93.0 | Ogallala | Oct. 31 | 56 | 256 | 18 | 0.84 | 53 2.64 |
10 0.82 |
25 1.07 |
227 3.72 |
10 0.21 |
9.0 0.25 |
1.2 0.06 |
18 0.29 |
173 | 173 | 0 |
| T. 11 S., R. 40 W. | ||||||||||||||||||
| 11-40-1bcc | 94.0 | Pierre | Oct. 31 | 58 | 579 | 33 | 0.28 | 60 2.99 |
38 3.12 |
81 3.51 |
256 4.20 |
174 3.62 |
53 1.49 |
2.3 0.12 |
12 0.19 |
306 | 210 | 96 |
| a. One part per million is eqivalent to one pound of substance per million pounds of water or 8.33 pounds per million gallons of water. b. An equivalent per million is a unit chemical equivalent weight of solute per million unit weights of solution. Concentration in equivalents per million is calculated by dividing the concentration in parts per million by the chemical combining weight of the substance or ion. |
||||||||||||||||||
Chemical Constituents in Relation to Use
The following discussion of the chemical constituents of ground water has been adapted in part from publications of the Federal Geological Survey and the State Geological Survey of Kansas.
Dissolved solids--When water is evaporated the residue consists of rock materials and sometimes a small quantity of water of crystallization and organic material. The kind and quantity of these soluble rock materials in the water determine its suitability for use. Water with less than 500 parts per million of dissolved solids generally is satisfactory for domestic use, except for the difficulties resulting from its hardness, and, in some areas, corrosiveness to iron. Water with more than 1,000 parts per million is likely to contain enough of certain constituents to produce a noticeable taste or to make the water unsuitable in some other respect.
The dissolved solids in samples of water from Sherman County ranged from 224 to 579 parts per million. Only one sample contained more than 500 parts per million (Table 8). The water therefore is suitable for most ordinary uses from the standpoint of dissolved solids.
Table 8--Summary of the chemical quality of the samples of water from typical wells in Sherman County.
| Range in parts per million |
Number of samples | ||
|---|---|---|---|
| Alluvium | Ogallala formation |
Pierre shale |
|
| Dissolved solids | |||
| 200-250 | 1 | ||
| 251-300 | 20 | ||
| 301-350 | 1 | ||
| 351-400 | |||
| 401-600 | 1 | 1a | |
| Total hardness | |||
| 100-150 | 8 | ||
| 151-200 | 13 | ||
| 201-250 | |||
| 251-300 | 1 | 1 | |
| 301-350 | 1 | ||
| Fluoride | |||
| 0.5-1.0 | 1 | 4 | |
| 1.1-1.5 | 9 | ||
| 1.6-2.0 | 9 | ||
| 2.1-2.5 | 1 | ||
| Iron | |||
| 0.0-.10 | 1 | 5 | |
| .11-.20 | 3 | ||
| .21-.50 | 2 | 1 | |
| .51-1.0 | 4 | ||
| 1.1-2.0 | 7 | ||
| 2.1-5.5 | 1b | ||
| a. 579 parts per million. b. 5.4 parts per million. |
|||
Hardness--Hardness of water is most commonly recognized by the excessive quantity of soap needed with the water in washing and by the curdy precipitate that forms before a permanent lather is obtained. Calcium and magnesium cause practically all the hardness of ordinary water and are the active agents in the formation of the greater part of the scale formed in steam boilers and in other vessels in which water is heated or evaporated.
Hardness is of two types--carbonate and noncarbonate. Carbonate hardness is caused by calcium and magnesium bicarbonate, and because it can be removed almost entirely by boiling, is often called temporary hardness. Noncarbonate hardness, or permanent hardness, is caused by sulfates, chlorides, nitrates, and fluorides of calcium and magnesium and cannot be removed by boiling. With reference to use with soap, there is no difference between carbonate and noncarbonate hardness. In general noncarbonate hardness forms harder scale on steam boilers.
Water having a hardness of less than 50 parts per million is generally considered as soft and treatment to remove hardness is usually unnecessary. Hardness between 50 and 150 parts per million does not seriously interfere with the use of water for most purposes but does increase the consumption of soap and its removal by a softening process may be profitable for laundries or other industries that use large quantities of soap. Treatment for the prevention of scale is necessary for the successful operation of steam boilers using water in the upper part of this range of hardness. Hardness of more than 150 parts per million is easily noticeable and water having more than 200 parts per million is sometimes treated to soften it. Where municipal water supplies are softened, the hardness is usually reduced to 60 to 80 parts per million.
Samples of water from Sherman County were moderately hard. Only three samples had more than 200 parts per million of hardness.
Iron--If water contains much more than 0.3 part per million of iron, the excess may separate out and settle as a reddish sediment when exposed to the air. Iron, which may be present in sufficient quantity to give a disagreeable taste or to stain cooking utensils, may be removed from most water by aeration and filtration, but some requires additional treatment.
In water samples collected in Sherman County the iron content ranged from 0.05 to 5.4 parts per million. Six samples contained 0.1 part per million or less, 17 contained from 0.11 to 2.0 parts per million, and 1 sample contained more than 2.0 parts per million of iron. However, it is believed that well 6-37-11bcc, from which the sample containing 5.4 parts per million of iron was obtained, may not have been pumped long enough to clear the pipes of rusty water and consequently the amount of iron in the sample may be greatly in excess of the amount normally expected.
Fluoride--Although fluoride is usually present only in small quantities in ground water, it is desirable to know the amount of fluoride present in water used by children. Fluoride in water has been shown to be associated with the dental defect known as mottled enamel, which may appear on the teeth of children who drink water containing too much fluoride during the formation of the permanent teeth. Dean (1936) has described the effects of fluoride in drinking water on the teeth of children (p. 1270):
. . . from the continuous use of water containing about 1 part per million, it is probable that the very mildest forms of mottled enamel may develop in about 10 per cent of the group. In waters containing 1.7 or 1.8 parts per million, the incidence may be expected to rise 40 or 50 per cent, although the percentage distribution of severity would be largely of the "very mild" and "mild" types. At 2.5 parts per million an incidence of about 75 to 80 per cent might be expected, with possibly 20 to 25 per cent of all cases falling into the 11 moderate" or severer type. A scattering few may show the "moderately severe" type.
At 4 parts per million the incidence is, in general, in the neighborhood of 90 per cent, and as a rule, 35 per cent or more of the children are classified as "moderate" or worse. In concentrations of 6 parts per million or higher an incidence of 100 per cent is not unusual.
Recent studies have indicated that whereas more than 1.5 parts per million of fluoride may be detrimental to the teeth of children, less than 1.5 parts is definitely beneficial in helping to prevent tooth decay.
Of 24 water samples collected in Sherman County, 5 contained 1.0 or less part per million of fluoride; 9 samples contained from 1.1 to 1.5 parts per million, 9 contained from 1.6 to 2.0, and only 1 contained more than 2 parts per million of fluoride.
Nitrate--The nitrate content of water used for drinking has been the object of a great deal of attention in the past few years since the discovery that high nitrate water may cause cyanosis of infants when the water is used in the preparation of the baby's formula. Although some nitrates are derived from nitrate-bearing rocks and minerals in the water-bearing formations, high nitrate concentrations are probably due to direct flow of surface water into the well or to percolation of nitrate-bearing water into the well through the top few feet of the well. Nitrates, very soluble, are readily dissolved from soils that have high concentrations of nitrate. Other sources of nitrogenous material are privies, cesspools, and barnyards; consequently a large amount of nitrate may also indicate that harmful bacteria are present in the water. Because they are usually poorly sealed, dug wells generally allow more contamination by surface seepage than drilled wells which are commonly deeper and usually tightly cased.
Ninety parts per million of nitrate as NO3 in water is considered by the Kansas State Board of Health as dangerous to infants, and some authorities advocate that water containing more than 45 parts per million (as NO3) should not be used for formula preparation. All water samples collected in Sherman County contained some nitrate, but none contained enough nitrate to be considered dangerous. Most of the wells in Sherman County are drilled, relatively deep, generally well cased and sealed, and are not readily contaminated. One water sample had 40 parts per million but all others had less than 20 parts per million of nitrate.
Water for Irrigation
The suitability of a water for irrigation is dependent mainly on the concentration of dissolved constituents and the percentage of sodium. The quantity of chloride is sometimes large enough to affect use of water for irrigation and boron is sometimes present in sufficient amounts to be harmful to plants. The concentration of dissolved constituents may be expressed in terms of equivalents per million of anions or cations, of parts per million of dissolved solids, or in terms of electrical conductivity. Electrical conductivity is the measure of the ability of the inorganic salts in solution to conduct an electric current, and it is related to the concentration of dissolved solids. Electrical conductivity measurements are not shown in analyses of water from Sherman County, but an approximate value can be obtained by multiplying total equivalents per million of anions or cations by 100, or by dividing dissolved solids in parts per million by 0.7 (Wilcox, 1948, pp. 4-5). To find the percentage of sodium, the results of the analysis must be reported in equivalents per million. The quantity of sodium in equivalents is then divided by the sum of the quantities of calcium, magnesium, sodium, and potassium in equivalents, and the result expressed as a percentage.
The classification of water for irrigation use is shown in Table 9.
Table 9--Permissible limits for electrical conductivity and percentage sodium of several classes of irrigation water (Wilcox, 1948a, p. 27)
| Classes of water | Electrical conductivity (micromhos at 25° C) |
Percent sodium |
|
|---|---|---|---|
| Rating | Grade | ||
| 1 | Excellent | less than 250 | less than 20 |
| 2 | Good | 250-750 | 20-40 |
| 3 | Permissible | 750-2,000 | 40-60 |
| 4 | Doubtful | 2,000-3,000 | 60-80 |
| 5 | Unsuitable | more than 3,000 | more than 80 |
This table shows that, in general, water containing more than 60 percent sodium or water having electrical conductance of more than 2,000 is unfit for irrigation. All samples of water from Sherman County that were analyzed are well within the safety limits suggested by Wilcox.
Sanitary Conditions
The analyses of water given in the tables show only the amounts of dissolved mineral matter in the water and do not indicate the sanitary quality of the water. The water in a well may contain mineral matter that imparts an objectionable odor or taste and yet may be free from harmful bacteria and safe for drinking. On the other hand, the water in a well although clear and palatable may contain harmful bacteria. An abnormal amount of certain mineral constituents, such as nitrate or chloride, sometimes indicates pollution.
The entire population of Sherman County is dependent upon well-water supplies and every precaution should be taken to protect these supplies from pollution. Deep drilled wells on the uplands penetrate relatively impervious silt above the water table and are less subject to pollution than are shallow wells in valleys where pervious sandy material sometimes extends from the surface to the water table. Every well should be tightly sealed at the top and if possible should be located in a raised area so that surface water will run away from rather than into the well. Wells should not be located where barnyards, privies, or cesspools are possible sources of pollution.
Prev Page--Recovery and Utilization || Next Page--Formations
Kansas Geological Survey, Geology
Placed on web Aug. 1, 2008; originally published Nov. 1953.
Comments to webadmin@kgs.ku.edu
The URL for this page is http://www.kgs.ku.edu/General/Geology/Sherman/05_gw4.html