Hodgeman County Study, part 11 of 12
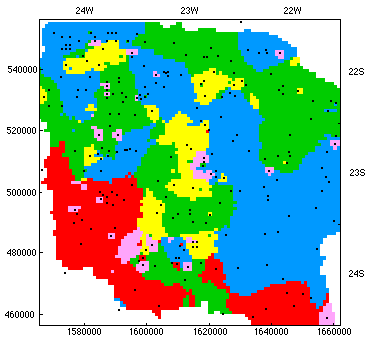
Figure 9. Regionalized classification of the Dakota aquifer, southcentral Hodgeman County, Kansas. Lavender denotes allocation to group 23, red to 26, yellow to 36, green to 65, and blue to 81.
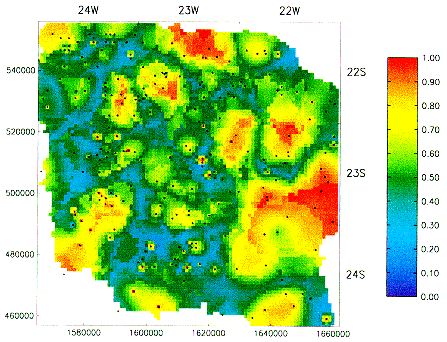
The group membership probabilities of the allocations are in Figure 10. They are the highest group membership probability per node.
Figure 10. Group membership probabilities in the regionalized classification of the Dakota aquifer, southcentral Hodgeman County, Kansas.
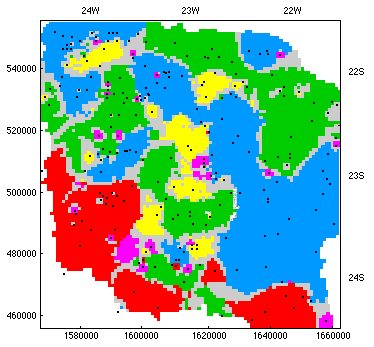
Considering that the allocation is done for the most part based on estimated probabilities based on probabilities calculated by Algorithm 2 at the wells, membership probabilities away from wells may be in error. Hence close membership probabilities have potential for misclassification. The map in Figure 11 repeats the one in Figure 10 by eliminating those nodes whose difference between the highest and second highest probabilities is less than 0.1 times the sum of their kriging variances.
Figure 11. Regionalized classification of the Dakota aquifer, southcentral Hodgeman County, Kansas, eliminating maximum uncertainty allocations shown as gray areas. Lavender denotes allocation to group 23, red to 26, yellow to 36, green to 65, and blue to 81.
Previous Page--Mapping of probabilities ||
Next Page--Conclusions
Dakota Home ||
Start of Hodgeman County Study