Kansas Geological Survey, Current Research in Earth Sciences, Bulletin 258, part 3
Prev Page--Introduction, Regional Information || Next Page--Results
![]()
![]()
![]()
Kansas Geological Survey, Current Research in Earth Sciences, Bulletin 258, part 3
Prev Page--Introduction, Regional Information ||
Next Page--Results
![]()
Water samples were collected monthly from nine public water-supply wells located within the transition zone in Crawford and Cherokee counties in southeast Kansas (fig. 1; table 1). Newer wells tapping supplies in the Ozark Plateaus aquifer system are steel-cased through the Pennsylvanian to prevent fluids and natural gas from entering the well in the upper part of the boreholes. Below the casing and down to total depth, wells are completed as open boreholes from which water is produced. Five of the monitored wells tap supplies in the Ozark aquifer, and three tap supplies in both the Springfield Plateau and the Ozark aquifers (referred to in this paper as multi-aquifer wells). Of the three multi-aquifer wells, the older Weir city well potentially taps minor sources of water in the overlying Pennsylvanian rocks in addition to the Springfield Plateau and Ozark aquifers.
Water samples were collected in 500-mL polyethylene bottles after the well had been pumped for at least 15 minutes, or after the specific conductance and temperature had stabilized. If the well was running on arrival at the site, the water-supply operator was queried to obtain an estimate of how long the well had been pumping. Most of the time the well had been running for at least one hour prior to sampling. Some of the wells could not be sampled every month because of restrictions on the amount of water that could be pumped or mechanical problems.
Temperature, pH, and specific conductance were measured at the time of sampling. Samples were kept in an ice-chest after collection and later transferred to a refrigerator in the Analytical Services laboratory at the Kansas Geological Survey (KGS).
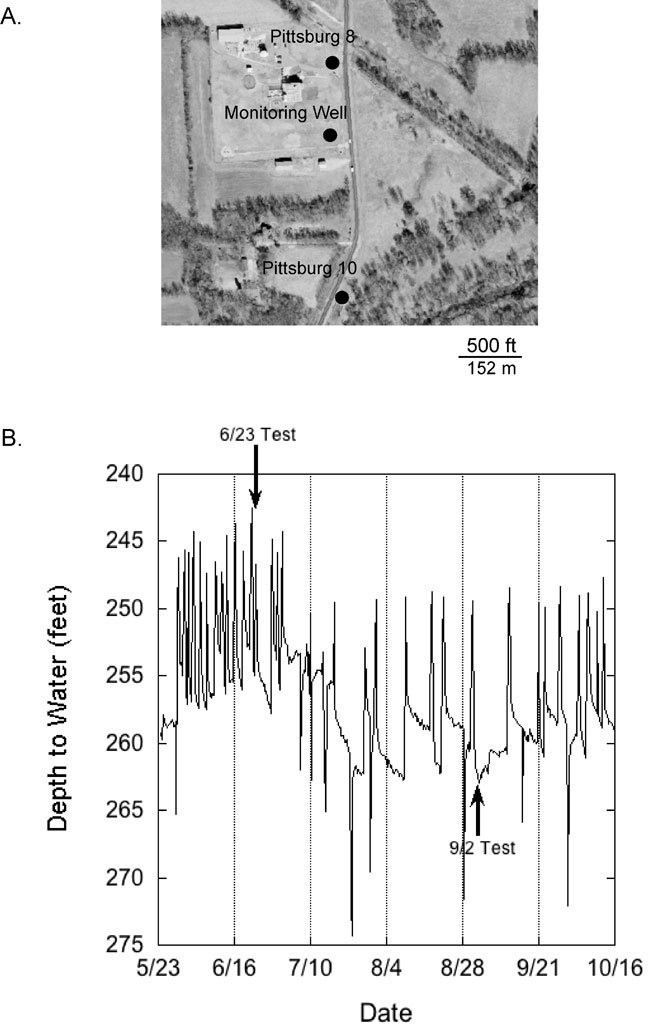
Water-quality pumping tests were conducted to assess changes in the chemistry of produced water over a single pumping period. Well 8 in the Pittsburg well field was selected for testing because it had been sampled monthly in the previous phase of this research. It is located on the western side of the regional cone of depression in the Ozark aquifer potentiometric surface (fig. 2) and structurally near the crest of the Pittsburg anticline (fig. 3; Macfarlane and Hathaway, 1987). Well 8 is cased through the overlying Springfield Plateau aquifer and was completed as an open borehole from the Jefferson City Dolomite into the upper part of the Gasconade Dolomite (table 3). Water is produced from the well by a turbine pump at the rate 1,875 gal/minute (118 L/second).
In 2008, tests were conducted in late June near the beginning of what is normally a period of high water demand and in early September just after the time of peak demand. The monitoring well hydrograph in fig. 5 shows that the elevation of the potentiometric surface is generally higher during low pumping-stress periods than it is during high pumping-stress conditions. The June test duration was 50.7 hours, during which 26 water samples were collected, and the September test duration was 51.8 hours, during which 28 samples were collected. The interval between samplings varied from 15 minutes to 8.8 hours in the June test and from 30 minutes to 3 hours in the September test.
Figure 5--(A) Aerial photograph showing the location of the observation well (from which the hydrograph in B was generated) in relation to wells 8 and 10 in the city of Pittsburg, Kansas, field. (B) Hydrograph of the monitoring well completed in the Ozark aquifer in the Pittsburg well field showing depth to water from land surface. The arrows indicate the approximate start time of each chemical-quality pumping test.
Samples were refrigerated until processed in the KGS laboratory. Specific conductance and pH were measured after the samples had equilibrated to room temperature. Samples were then analyzed for calcium, magnesium, strontium, sodium, potassium, bicarbonate, sulfate, and chloride. Anion analyses were performed using ion chromatography with a Dionex ICS-3000 and cation concentrations were measured using a Jarrel-Ash ICP. Prior to analysis, samples processed for the Dionex and the Jarrel-Ash were passed through 0.2-micron and 0.45-micron filters, respectively. Bicarbonate was determined using an automated titrimeter. Most of the analytical results are within 2% of electrical balance based on milliequivalent/liter (meq/L) values, and all of the analyses are within 5% of balance. TDS concentration was calculated by summing the major and minor constituent concentrations. In the TDS calculation, the bicarbonate concentration was multiplied by 49.17% to approximate the amount of carbonate that would be left in the residual solids after evaporating to dryness. The analytical results are in tables 4-15. Water-type classification is based on whether the percent meq/L contributions of individual dissolved cations and anions exceed 50% of the total meq/L concentration of cations or anions. Waters in which none of the constituent concentrations exceed 50% of the total cations or anions were classified as mixed.
Table 4--Water type and TDS concentration range for each of the nine wells sampled monthly from 2006-08.
| Water Supply Well | Water Type | TDS Concentration Range (mg/L) |
Number of Samples |
|---|---|---|---|
| Cherokee RWD 3 well 1 | Sodium-chloride | 541-644 | 20 |
| Columbus well 4 | Mixed cation-bicarbonate to sodium-bicarbonate | 466-617 | 19 |
| Crawford Consolidated RWD 1 well 2 | Mixed cation-mixed anion | 663-721 | 20 |
| Crawford RWD 4 well 3 | Mixed cation-bicarbonate | 478-534 | 20 |
| Crawford RWD 5 well 1 | Mixed cation-bicarbonate | 516-566 | 20 |
| Girard 3 | Mixed cation-mixed anion | 639-674 | 20 |
| Pittsburg 8 | Mixed cation-bicarbonate | 481-551 | 16 |
| Pittsburg 10 | Mixed cation-bicarbonate | 516-545 | 3 |
| Weir | Mixed cation-bicarbonate | 396-497 | 18 |
Table 5--Chemical analyses of the monthly 2006-08 samples collected from Cherokee RWD 3 well 1.
| Date Sampled |
Sp. Con. (µS/cm) |
pH | TDS (mg/L) |
Ca (mg/L) |
Mg (mg/L) |
Na (mg/L) |
K (mg/L) |
Sr (mg/L) |
HCO3 (mg/L) |
SO4 (mg/L) |
Cl (mg/L) |
|---|---|---|---|---|---|---|---|---|---|---|---|
| 4/13/2006 | 1081 | 7.60 | 590 | 44.4 | 21.9 | 136 | 7.5 | 1.32 | 220 | 39.6 | 211 |
| 5/15/2006 | 1040 | 7.40 | 572 | 46.3 | 22.2 | 134 | 6.4 | 1.26 | 216 | 45.5 | 199 |
| 6/15/2006 | 1010 | 7.45 | 559 | 45.9 | 22.3 | 130 | 6.2 | 1.21 | 212 | 43.2 | 195 |
| 7/13/2006 | 1067 | 7.83 | 578 | 45.5 | 22.2 | 136 | 6.8 | 1.32 | 221 | 36.8 | 209 |
| 8/15/2006 | 1140 | 8.00 | 592 | 44.1 | 21.8 | 142 | 8.3 | 1.38 | 224 | 42.7 | 210 |
| 9/19/2006 | 1052 | 8.10 | 570 | 45.7 | 22.1 | 129 | 5.6 | 1.19 | 219 | 44.8 | 203 |
| 10/16/2006 | 1021 | 7.52 | 562 | 46.8 | 22.5 | 133 | 6.0 | 1.31 | 209 | 40.0 | 198 |
| 11/21/2006 | 1051 | 7.80 | 583 | 46.1 | 22.7 | 134 | 6.3 | 1.27 | 214 | 46.8 | 209 |
| 12/19/2006 | 1011 | 8.00 | 564 | 46.5 | 22.6 | 129 | 5.8 | 1.19 | 213 | 42.9 | 200 |
| 1/26/2007 | 1072 | 7.80 | 598 | 45.3 | 22.1 | 144 | 7.1 | 1.36 | 223 | 38.4 | 219 |
| 3/20/2007 | 1137 | 7.90 | 618 | 46.0 | 22.5 | 149 | 6.7 | 1.30 | 239 | 47.2 | 217 |
| 4/1/2007 | 1159 | 7.80 | 641 | 44.5 | 22.3 | 161 | 7.2 | 1.44 | 263 | 42.8 | 222 |
| 5/15/2007 | 1163 | 7.95 | 644 | 47.2 | 22.8 | 152 | 7.3 | 1.50 | 243 | 47.5 | 235 |
| 6/1/2007 | 1036 | 7.80 | 573 | 46.8 | 22.3 | 133 | 6.1 | 1.28 | 215 | 43.4 | 205 |
| 8/1/2007 | 1031 | 7.34 | 558 | 47.8 | 22.8 | 129 | 6.0 | 1.24 | 210 | 44.5 | 193 |
| 10/1/2007 | 1085 | 7.65 | 591 | 47.5 | 22.5 | 137 | 6.8 | 1.37 | 224 | 42.7 | 211 |
| 12/1/2007 | 1145 | 7.90 | 545 | 49.5 | 23.4 | 129 | 6.0 | 1.23 | 211 | 31.9 | 189. |
| 1/04/2008 | 931 | 7.40 | 585 | 45.3 | 21.9 | 138 | 6.6 | 1.33 | 233 | 47.3 | 200 |
| 1/25/2008 | 1015 | 7.41 | 571 | 46.8 | 22.7 | 131 | 6.1 | 1.25 | 222 | 41.9 | 201 |
| 2/28/2008 | 1044 | 7.29 | 541 | 47.6 | 22.7 | 136 | 6.4 | 1.32 | 176 | 34.2 | 195 |
Table 6--Chemical analyses of the monthly 2006-08 samples collected from Columbus well 4.
| Date Sampled |
Sp. Con. (µS/cm) |
pH | TDS (mg/L) |
Ca (mg/L) |
Mg (mg/L) |
Na (mg/L) |
K (mg/L) |
Sr (mg/L) |
HCO3 (mg/L) |
SO4 (mg/L) |
Cl (mg/L) |
|---|---|---|---|---|---|---|---|---|---|---|---|
| 4/13/2006 | 828 | 7.73 | 487 | 48.3 | 24.6 | 93.5 | 6.6 | 1.37 | 356 | 57.6 | 63.2 |
| 5/15/2006 | 796 | 7.62 | 491 | 49.1 | 24.8 | 91.8 | 5.7 | 1.35 | 361 | 69.7 | 59.1 |
| 6/15/2006 | 789 | 7.66 | 477 | 48.5 | 24.2 | 91.4 | 6.0 | 1.36 | 362 | 53.3 | 62.5 |
| 8/15/2006 | 966 | 8.00 | 574 | 53.3 | 26.9 | 122 | 7.3 | 1.50 | 350 | 52.6 | 126 |
| 9/19/2006 | 872 | 7.85 | 519 | 50.6 | 24.9 | 102 | 5.8 | 1.45 | 357 | 61.8 | 85.1 |
| 10/16/2006 | 904 | 7.52 | 536 | 53.2 | 26.3 | 110 | 6.2 | 1.53 | 354 | 59.1 | 93.2 |
| 11/21/2006 | 982 | 7.70 | 579 | 52.8 | 26.4 | 122 | 7.0 | 1.49 | 361 | 62.7 | 117 |
| 12/19/2006 | 726 | 7.65 | 473 | 47.9 | 25.0 | 91.8 | 5.5 | 1.32 | 363 | 46.9 | 64.4 |
| 1/26/2007 | 866 | 7.85 | 512 | 50.5 | 25.1 | 104 | 6.5 | 1.40 | 364 | 46.5 | 86.5 |
| 3/19/2007 | 886 | 7.95 | 496 | 51.5 | 24.9 | 97 | 5.7 | 1.30 | 366 | 55.5 | 69.1 |
| 4/1/2007 | 1037 | 7.80 | 594 | 54.8 | 27.0 | 127 | 6.6 | 1.59 | 356 | 54.5 | 136 |
| 6/1/2007 | 815 | 7.70 | 470 | 50.1 | 24.9 | 91.0 | 5.2 | 1.38 | 362 | 47.0 | 61.4 |
| 8/1/2007 | 980 | 7.20 | 573 | 53.6 | 25.7 | 121 | 7.0 | 1.54 | 361 | 66.3 | 108 |
| 10/1/2007 | 1096 | 7.56 | 617 | 57.4 | 27.5 | 134 | 7.6 | 1.65 | 353 | 62.3 | 141 |
| 12/1/2007 | 1102 | 7.58 | 612 | 55.0 | 27.2 | 137 | 7.0 | 1.59 | 364 | 54.6 | 140 |
| 1/04/2008 | 787 | 7.45 | 530 | 52.0 | 25.4 | 111 | 6.8 | 1.48 | 362 | 54.7 | 88.8 |
| 1/25/2008 | 776 | 7.62 | 466 | 48.7 | 24.6 | 94.4 | 5.7 | 1.37 | 374 | 39.3 | 56.0 |
| 2/28/2008 | 806 | 7.42 | 469 | 50.8 | 24.8 | 94.9 | 6.2 | 1.44 | 359 | 43.0 | 59.4 |
| 5/15/2008 | 829 | 7.75 | 484 | 51.6 | 25.3 | 93.3 | 5.4 | 1.41 | 361 | 55.1 | 62.3 |
Table 7--Chemical analyses of the monthly 2006-08 samples collected from Crawford RWD 4 well 3.
| Date Sampled |
Sp. Con. (µS/cm) |
pH | TDS (mg/L) |
Ca (mg/L) |
Mg (mg/L) |
Na (mg/L) |
K (mg/L) |
Sr (mg/L) |
HCO3 (mg/L) |
SO4 (mg/L) |
Cl (mg/L) |
|---|---|---|---|---|---|---|---|---|---|---|---|
| 4/13/2006 | 917 | 7.32 | 511 | 64.9 | 31.0 | 78.1 | 9.9 | 1.15 | 337 | 72.9 | 86.2 |
| 5/15/2006 | 907 | 7.41 | 534 | 68.4 | 32.2 | 80.6 | 7.7 | 1.22 | 332 | 80.2 | 99.3 |
| 6/15/2006 | 886 | 7.25 | 508 | 67.8 | 31.7 | 79.9 | 6.7 | 1.20 | 329 | 80.0 | 78.4 |
| 7/13/2006 | 905 | 7.46 | 506 | 64.0 | 30.5 | 76.0 | 7.1 | 1.13 | 335 | 79.8 | 82.0 |
| 8/15/2006 | 910 | 7.75 | 514 | 65.7 | 32.1 | 78.0 | 6.6 | 1.14 | 329 | 83.2 | 84.8 |
| 9/19/2006 | 919 | 7.95 | 522 | 66.5 | 31.6 | 78.5 | 5.7 | 1.17 | 333 | 88.8 | 85.1 |
| 10/16/2006 | 892 | 7.53 | 505 | 67.6 | 31.9 | 79.5 | 5.6 | 1.19 | 327 | 76.6 | 80.9 |
| 11/20/2006 | 918 | 7.45 | 524 | 66.2 | 31.5 | 78.4 | 5.7 | 1.17 | 333 | 88.7 | 87.7 |
| 12/18/2006 | 912 | 7.55 | 518 | 67.2 | 33.0 | 79.2 | 6.3 | 1.17 | 335 | 81.9 | 83.7 |
| 1/25/2007 | 901 | 7.45 | 517 | 68.3 | 31.9 | 80.5 | 6.5 | 1.19 | 330 | 79.5 | 85.6 |
| 3/19/2007 | 916 | 7.60 | 519 | 68.1 | 31.2 | 79.6 | 6.4 | 1.10 | 334 | 80.9 | 86.8 |
| 4/1/2007 | 914 | 7.50 | 511 | 66.8 | 31.5 | 77.8 | 6.0 | 1.21 | 334 | 75.5 | 86.7 |
| 5/14/2007 | 958 | 7.45 | 512 | 67.7 | 31.5 | 78.8 | 6.2 | 1.22 | 331 | 77.2 | 85.4 |
| 6/1/2007 | 908 | 7.45 | 519 | 67.3 | 30.8 | 78.7 | 6.3 | 1.19 | 331 | 85.5 | 85.6 |
| 8/1/2007 | 907 | 6.97 | 518 | 68.3 | 31.5 | 80.5 | 6.7 | 1.22 | 334 | 83.0 | 81.5 |
| 10/1/2007 | 1319 | 7.26 | 517 | 68.2 | 31.4 | 80.4 | 6.6 | 1.21 | 337 | 79.4 | 83.1 |
| 12/1/2007 | 925 | 7.21 | 504 | 71.2 | 33.6 | 83.2 | 6.7 | 1.26 | 336 | 60.8 | 81.4 |
| 1/04/2008 | 773 | 7.13 | 515 | 68.0 | 29.7 | 80.1 | 6.5 | 1.18 | 334 | 83.6 | 80.4 |
| 1/25/2008 | 875 | 7.16 | 513 | 67.8 | 31.0 | 80.1 | 6.5 | 1.20 | 331 | 77.8 | 84.5 |
| 2/27/2008 | 893 | 6.82 | 478 | 67.9 | 31.5 | 80.4 | 6.7 | 1.21 | 337 | 58.9 | 64.7 |
Table 8--Chemical analyses of the monthly 2006-08 samples collected from Crawford RWD 5 well 1.
| Date Sampled |
Sp. Con. (µS/cm) |
pH | TDS (mg/L) |
Ca (mg/L) |
Mg (mg/L) |
Na (mg/L) |
K (mg/L) |
Sr (mg/L) |
HCO3 (mg/L) |
SO4 (mg/L) |
Cl (mg/L) |
|---|---|---|---|---|---|---|---|---|---|---|---|
| 4/13/2006 | 680 | 7.62 | 545 | 46.9 | 21.0 | 66.7 | 4.3 | 0.64 | 291 | 26.7 | 69.7 |
| 5/15/2006 | 665 | 7.54 | 531 | 47.1 | 20.8 | 63.7 | 4.3 | 0.63 | 287 | 32.1 | 65.0 |
| 6/15/2006 | 660 | 7.40 | 538 | 46.9 | 21.0 | 65.5 | 4.0 | 0.64 | 290 | 26.1 | 73.4 |
| 7/13/2006 | 680 | 7.70 | 516 | 48.4 | 21.3 | 59.7 | 3.8 | 0.62 | 275 | 29.4 | 67.3 |
| 8/15/2006 | 651 | 7.90 | 520 | 47.1 | 21.2 | 61.0 | 4.2 | 0.61 | 279 | 27.9 | 68.5 |
| 9/19/2006 | 709 | 7.95 | 538 | 47.0 | 20.7 | 64.2 | 3.4 | 0.63 | 293 | 32.0 | 67.1 |
| 10/16/2006 | 662 | 7.42 | 523 | 49.4 | 21.5 | 61.1 | 3.2 | 0.63 | 279 | 31.3 | 66.8 |
| 11/20/2006 | 692 | 7.60 | 556 | 48.0 | 21.6 | 69.3 | 3.9 | 0.66 | 296 | 30.8 | 74.7 |
| 12/18/2006 | 682 | 7.80 | 540 | 46.4 | 21.0 | 66.9 | 4.0 | 0.64 | 295 | 29.2 | 66.3 |
| 1/25/2007 | 684 | 7.65 | 544 | 47.0 | 21.7 | 68.5 | 4.0 | 0.64 | 296 | 18.6 | 77.2 |
| 3/19/2007 | 691 | 7.80 | 541 | 47.1 | 20.9 | 66.8 | 4.1 | 0.60 | 293 | 31.4 | 66.8 |
| 4/1/2007 | 675 | 7.60 | 525 | 49.0 | 21.9 | 62.3 | 3.6 | 0.64 | 286 | 22.4 | 69.0 |
| 5/14/2007 | 705 | 7.75 | 535 | 48.4 | 21.2 | 67.6 | 3.9 | 0.67 | 285 | 31.1 | 67.6 |
| 6/1/2007 | 694 | 8.00 | 541 | 49.2 | 21.6 | 70.7 | 4.0 | 0.69 | 296 | 19.2 | 70.6 |
| 8/1/2007 | 685 | 7.16 | 546 | 48.0 | 21.1 | 69.6 | 4.2 | 0.68 | 297 | 31.1 | 64.2 |
| 10/1/2007 | 686 | 7.45 | 566 | 48.9 | 22.4 | 65.9 | 3.9 | 0.64 | 319 | 29.5 | 65.6 |
| 12/1/2007 | 692 | 7.51 | 534 | 49.7 | 21.7 | 69.3 | 4.1 | 0.68 | 293 | 22.5 | 63.4 |
| 1/04/2008 | 579 | 7.22 | 525 | 48.0 | 20.9 | 65.7 | 3.8 | 0.65 | 285 | 29.1 | 62.9 |
| 1/25/2008 | 654 | 7.28 | 527 | 48.5 | 21.4 | 65.8 | 3.8 | 0.66 | 292 | 22.9 | 63.4 |
| 2/27/2008 | 660 | 7.10 | 522 | 48.4 | 21.3 | 64.0 | 4.0 | 0.64 | 290 | 22.8 | 60.9 |
Table 9--Chemical analyses of the monthly 2006-08 samples collected from Crawford Consolidated RWD 1 well 2.
| Date Sampled | Sp. Con. (µS/cm) |
pH | TDS (mg/L) |
Ca (mg/L) |
Mg (mg/L) |
Na (mg/L) |
K (mg/L) |
Sr (mg/L) |
HCO3 (mg/L) |
SO4 (mg/L) |
Cl (mg/L) |
|---|---|---|---|---|---|---|---|---|---|---|---|
| 4/13/2006 | 1247 | 6.97 | 684 | 74.8 | 34.8 | 130 | 6.1 | 1.51 | 331 | 97.6 | 176 |
| 5/15/2006 | 1247 | 7.06 | 686 | 76.1 | 35.2 | 128 | 7.4 | 1.48 | 323 | 99.9 | 178 |
| 6/15/2006 | 1248 | 7.24 | 663 | 75.8 | 35.3 | 130 | 7.9 | 1.49 | 291 | 89.8 | 179 |
| 7/13/2006 | 1233 | 7.31 | 689 | 75.3 | 35.2 | 129 | 7.5 | 1.48 | 334 | 91.1 | 184 |
| 8/15/2006 | 1188 | 7.50 | 677 | 75.3 | 34.6 | 128 | 6.8 | 1.47 | 326 | 89.3 | 181 |
| 9/19/2006 | 1229 | 7.50 | 688 | 74.3 | 34.8 | 127 | 6.7 | 1.46 | 325 | 106 | 177 |
| 10/16/2006 | 1211 | 7.24 | 676 | 75.8 | 35.5 | 129 | 6.8 | 1.49 | 323 | 92.1 | 176 |
| 11/20/2006 | 1250 | 7.30 | 679 | 74.0 | 34.5 | 127 | 6.9 | 1.45 | 326 | 96.5 | 178 |
| 12/18/2006 | 1136 | 7.45 | 708 | 76.6 | 35.4 | 131 | 7.0 | 1.50 | 330 | 102 | 191 |
| 1/25/2007 | 1223 | 7.30 | 682 | 75.6 | 34.6 | 130 | 7.4 | 1.45 | 324 | 90.5 | 183 |
| 3/19/2007 | 1239 | 7.45 | 684 | 77.0 | 34.3 | 130 | 7.2 | 1.50 | 330 | 97.0 | 174 |
| 4/1/2007 | 1255 | 7.20 | 721 | 77.0 | 35.3 | 131 | 7.1 | 1.54 | 334 | 109 | 195 |
| 5/14/2007 | 1270 | 7.35 | 694 | 76.7 | 35.3 | 132 | 7.0 | 1.55 | 321 | 92.9 | 190 |
| 6/1/2007 | 1137 | 7.35 | 680 | 77.6 | 35.1 | 132 | 7.1 | 1.56 | 328 | 89.4 | 176 |
| 8/1/2007 | 1225 | 6.87 | 695 | 77.6 | 35.0 | 132 | 7.4 | 1.57 | 334 | 101 | 175 |
| 10/1/2007 | 1245 | 6.93 | 681 | 74.6 | 34.1 | 125 | 7.0 | 1.49 | 327 | 97.8 | 180 |
| 12/1/2007 | 1261 | 7.18 | 672 | 78.2 | 36.0 | 132 | 7.4 | 1.57 | 336 | 74.7 | 176 |
| 1/04/2008 | 1055 | 7.09 | 676 | 77.6 | 35.6 | 133 | 7.5 | 1.56 | 294 | 101 | 175 |
| 1/25/2008 | 1195 | 7.06 | 704 | 77.6 | 35.5 | 132 | 7.1 | 1.55 | 332 | 102 | 183 |
| 2/27/2008 | 1221 | 6.60 | 690 | 77.8 | 35.4 | 133 | 7.5 | 1.56 | 335 | 95.9 | 174 |
Table 10--Chemical analyses of the monthly 2006-08 and other samples collected from Girard well 3.
| Date Sampled |
Sp. Con. (µS/cm) |
pH | TDS (mg/L) |
Ca (mg/L) |
Mg (mg/L) |
Na (mg/L) |
K (mg/L) |
Sr (mg/L) |
HCO3 (mg/L) |
SO4 (mg/L) |
Cl (mg/L) |
|---|---|---|---|---|---|---|---|---|---|---|---|
| 4/13/2006 | 1157 | 7.34 | 639 | 71.0 | 33.0 | 113 | 7.4 | 1.33 | 323 | 90.0 | 153 |
| 5/15/2006 | 1165 | 7.48 | 654 | 69.9 | 33.1 | 118 | 7.4 | 1.31 | 315 | 88.4 | 163 |
| 6/15/2006 | 1112 | 7.30 | 674 | 72.9 | 32.9 | 113 | 7.3 | 1.36 | 314 | 99.0 | 153 |
| 7/13/2006 | 1171 | 7.47 | 661 | 74.7 | 34.1 | 120 | 7.5 | 1.34 | 324 | 90.7 | 164 |
| 8/15/2006 | 1108 | 7.65 | 656 | 72.3 | 33.2 | 115 | 7.2 | 1.33 | 313 | 98.9 | 155 |
| 9/19/2006 | 1183 | 7.19 | 672 | 75.9 | 35.2 | 118 | 7.0 | 1.45 | 320 | 101 | 172 |
| 10/16/2006 | 1144 | 7.62 | 651 | 74.4 | 33.9 | 118 | 6.3 | 1.35 | 313 | 95.2 | 155 |
| 11/20/2006 | 1189 | 7.45 | 655 | 74.0 | 33.6 | 120 | 6.6 | 1.33 | 318 | 92.8 | 169 |
| 12/18/2006 | 1145 | 7.65 | 656 | 75.4 | 34.9 | 121 | 7.0 | 1.38 | 320 | 97.2 | 179 |
| 1/25/2007 | 1184 | 7.60 | 661 | 75.5 | 33.2 | 122 | 6.9 | 1.33 | 314 | 92.1 | 175 |
| 3/19/2007 | 1181 | 7.80 | 673 | 75.7 | 33.1 | 120 | 6.8 | 1.30 | 320 | 95.6 | 165 |
| 4/1/2007 | 1164 | 7.45 | 663 | 77.6 | 34.0 | 122 | 7.1 | 1.43 | 319 | 109 | 164 |
| 5/14/2007 | 1221 | 7.60 | 639 | 75.3 | 34.1 | 123 | 6.5 | 1.39 | 309 | 90.2 | 168 |
| 6/1/2007 | 1176 | 7.60 | 654 | 76.2 | 33.6 | 121 | 6.7 | 1.39 | 315 | 94.5 | 165 |
| 8/1/2007 | 1162 | 6.95 | 654 | 76.1 | 34.1 | 122 | 7.0 | 1.43 | 320 | 96.9 | 160 |
| 10/1/2007 | 1199 | 7.14 | 656 | 75.0 | 33.3 | 119 | 6.7 | 1.35 | 321 | 95.2 | 172 |
| 10/1/2007 | 1204 | 7.20 | 639 | 76.5 | 34.3 | 124 | 6.9 | 1.39 | 322 | 96.5 | 174 |
| 10/1/2007 | 1157 | 7.09 | 654 | 77.0 | 34.1 | 119 | 7.1 | 1.44 | 326 | 102 | 161 |
| 12/1/2007 | 1203 | 7.33 | 674 | 78.9 | 35.2 | 124 | 7.0 | 1.43 | 321 | 68.9 | 164 |
| 1/04/2008 | 991 | 7.30 | 661 | 76.4 | 34.0 | 120 | 7.0 | 1.40 | 319 | 99.3 | 159 |
| 1/25/2008 | 1116 | 7.28 | 656 | 74.9 | 33.7 | 117 | 6.8 | 1.40 | 321 | 101 | 160 |
| 2/27/2008 | 1164 | 6.97 | 672 | 76.1 | 33.7 | 123 | 7.0 | 1.39 | 321 | 94.7 | 161 |
Table 11--Chemical analyses of the monthly 2006-08 and other samples collected from Pittsburg well 8.
| Date Sampled |
Sp. Con. (µS/cm) |
pH | TDS (mg/L) |
Ca (mg/L) |
Mg (mg/L) |
Na (mg/L) |
K (mg/L) |
Sr (mg/L) |
HCO3 (mg/L) |
SO4 (mg/L) |
Cl (mg/L) |
|---|---|---|---|---|---|---|---|---|---|---|---|
| 4/13/2006 | 875 | 7.41 | 499 | 57.4 | 26.1 | 87.4 | 5.2 | 0.95 | 318 | 50.1 | 97.5 |
| 5/15/2006 | 911 | 7.43 | 517 | 61.4 | 27.9 | 90.7 | 6.6 | 0.97 | 315 | 56.1 | 107 |
| 6/15/2006 | 857 | 7.42 | 495 | 58.3 | 26.5 | 88.9 | 5.3 | 0.95 | 316 | 45.8 | 103 |
| 7/13/2006 | 897 | 7.47 | 509 | 59.1 | 26.9 | 88.8 | 6.1 | 0.95 | 322 | 47.0 | 111 |
| 8/15/2006 | 854 | 7.80 | 503 | 58.5 | 27.2 | 90.0 | 5.5 | 0.94 | 311 | 42.3 | 115 |
| 9/19/2006 | 913 | 7.75 | 516 | 59.2 | 27.0 | 88.9 | 4.6 | 0.95 | 319 | 57.9 | 109 |
| 11/20/2006 | 965 | 7.15 | 551 | 64.6 | 30.5 | 98.0 | 5.7 | 1.02 | 318 | 61.6 | 122 |
| 12/18/2006 | 907 | 7.75 | 514 | 59.3 | 27.5 | 90.3 | 5.0 | 0.95 | 319 | 46.4 | 117 |
| 1/25/2007 | 894 | 7.60 | 512 | 59.2 | 26.9 | 91.4 | 5.1 | 0.95 | 316 | 49.6 | 112 |
| 3/19/2007 | 900 | 7.60 | 515 | 59.7 | 26.5 | 89.1 | 5.2 | 0.90 | 319 | 55.2 | 110 |
| 3/20/2007 | 883 | 7.95 | 498 | 59.0 | 26.2 | 88.5 | 4.9 | 0.90 | 319 | 47.2 | 103 |
| 3/20/2007 | 882 | 7.80 | 506 | 58.6 | 26.0 | 87.7 | 5.0 | 0.90 | 318 | 54.4 | 106 |
| 4/1/2007 | 889 | 7.50 | 484 | 56.1 | 25.7 | 85.0 | 4.7 | 0.93 | 319 | 38.6 | 106 |
| 5/14/2007 | 904 | 7.60 | 494 | 58.7 | 26.2 | 88.1 | 4.9 | 0.96 | 315 | 42.6 | 107 |
| 10/1/2007 | 955 | 7.72 | 542 | 74.8 | 32.0 | 78.1 | 6.0 | 1.07 | 335 | 82.2 | 92.4 |
| 12/1/2007 | 991 | 7.24 | 535 | 65.6 | 29.9 | 92.6 | 5.2 | 1.01 | 319 | 49.2 | 125 |
| 12/1/2007 | 958 | 7.26 | 519 | 63.5 | 28.9 | 92.4 | 5.2 | 1.01 | 319 | 44.7 | 116 |
| 12/1/2007 | 933 | 7.31 | 510 | 62.0 | 28.4 | 91.3 | 5.1 | 0.99 | 320 | 42.9 | 112 |
| 12/1/2007 | 918 | 7.31 | 506 | 62.6 | 28.2 | 92.6 | 5.2 | 1.00 | 319 | 41.0 | 108 |
| 12/1/2007 | 903 | 7.35 | 498 | 61.1 | 27.6 | 91.6 | 5.3 | 0.99 | 320 | 38.9 | 104 |
| 1/25/2008 | 754 | 7.17 | 503 | 59.4 | 26.0 | 89.8 | 5.2 | 0.97 | 314 | 53.2 | 103 |
| 1/25/2008 | 858 | 7.31 | 500 | 58.7 | 26.0 | 88.5 | 4.9 | 0.96 | 319 | 48.0 | 106 |
| 2/27/2008 | 873 | 7.13 | 481 | 57.8 | 26.0 | 87.7 | 5.1 | 0.95 | 321 | 37.5 | 97.2 |
| 2/27/2008 | 874 | 7.17 | 495 | 57.9 | 26.3 | 88.3 | 5.2 | 0.96 | 323 | 45.3 | 101 |
| 2/27/2008 | 875 | 7.21 | 493 | 58.3 | 26.6 | 89.2 | 5.2 | 0.97 | 321 | 44.8 | 98.9 |
| 2/27/2008 | 875 | 7.13 | 506 | 58.8 | 26.7 | 89.9 | 5.2 | 0.98 | 322 | 53.2 | 102 |
| 2/27/2008 | 872 | 7.16 | 495 | 58.6 | 26.5 | 89.4 | 5.1 | 0.97 | 322 | 45.5 | 99.4 |
| 2/27/2008 | 875 | 7.18 | 502 | 60.2 | 27.3 | 91.8 | 5.3 | 1.00 | 322 | 45.5 | 102 |
| 2/27/2008 | 874 | 7.16 | 488 | 57.5 | 26.2 | 88.0 | 5.2 | 0.96 | 318 | 45.0 | 98.3 |
| 2/28/2008 | 869 | 7.16 | 495 | 58.7 | 26.5 | 89.7 | 5.3 | 0.98 | 320 | 45.7 | 100 |
| 2/28/2008 | 874 | 7.16 | 498 | 59.0 | 26.7 | 90.3 | 5.3 | 0.98 | 321 | 45.5 | 101 |
| 2/28/2008 | 873 | 7.20 | 494 | 58.2 | 26.4 | 88.9 | 5.2 | 0.97 | 322 | 45.4 | 99.5 |
| 2/28/2008 | 873 | 7.18 | 499 | 59.3 | 26.8 | 91.0 | 5.3 | 0.99 | 321 | 45.2 | 101 |
Table 12--Chemical analyses of the monthly 2006-07 samples collected from Pittsburg well 10. Water from this well was sampled when Pittsburg well 8 was unavailable.
| Date Sampled |
Sp. Con. (µS/cm) |
pH | TDS (mg/L) |
Ca (mg/L) |
Mg (mg/L) |
Na (mg/L) |
K (mg/L) |
Sr (mg/L) |
HCO3 (mg/L) |
SO4 (mg/L) |
Cl (mg/L) |
|---|---|---|---|---|---|---|---|---|---|---|---|
| 10/16/2006 | 873 | 7.23 | 516 | 59.2 | 27.0 | 88.9 | 4.6 | 0.95 | 319 | 57.9 | 109 |
| 6/1/2007 | 910 | 7.40 | 537 | 75.0 | 32.3 | 73.3 | 5.6 | 0.99 | 327 | 90.3 | 88.9 |
| 8/1/2007 | 934 | 6.96 | 545 | 75.2 | 32.4 | 78.4 | 6.0 | 1.07 | 333 | 86.3 | 90.8 |
Table 13--Chemical analyses of the monthly 2006-08 samples collected from the Weir city well.
| Date Sampled |
Sp. Con. (µS/cm) |
pH | TDS (mg/L) |
Ca (mg/L) |
Mg (mg/L) |
Na (mg/L) |
K (mg/L) |
Sr (mg/L) |
HCO3 (mg/L) |
SO4 (mg/L) |
Cl (mg/L) |
|---|---|---|---|---|---|---|---|---|---|---|---|
| 4/13/2006 | 707 | 7.54 | 423 | 62.1 | 29.7 | 47.8 | 5.69 | 1.04 | 325 | 61.3 | 35.0 |
| 5/15/2006 | 732 | 7.49 | 430 | 58.7 | 28.1 | 55.3 | 5.6 | 1.02 | 339 | 63.3 | 40.2 |
| 6/15/2006 | 722 | 7.55 | 440 | 61.1 | 29.5 | 61.4 | 5.4 | 1.07 | 344 | 59.9 | 40.7 |
| 7/13/2006 | 745 | 7.41 | 442 | 58.9 | 28.6 | 62.6 | 6.5 | 1.04 | 350 | 60.0 | 40.7 |
| 8/15/2006 | 700 | 7.85 | 417 | 60.5 | 29.4 | 51.0 | 5.8 | 1.04 | 327 | 61.0 | 36.5 |
| 9/19/2006 | 767 | 7.80 | 427 | 59.4 | 28.8 | 54.2 | 4.5 | 1.04 | 337 | 62.9 | 39.5 |
| 10/16/2006 | 824 | 7.34 | 497 | 49.5 | 27.2 | 97.0 | 4.2 | 1.10 | 405 | 53.0 | 55.0 |
| 11/21/2006 | 707 | 7.45 | 421 | 61.8 | 30.8 | 46.1 | 4.9 | 1.02 | 325 | 67.8 | 37.4 |
| 12/18/2006 | 726 | 7.65 | 432 | 59.6 | 29.9 | 56.6 | 5.1 | 1.03 | 339 | 62.2 | 39.0 |
| 1/26/2007 | 720 | 7.50 | 414 | 62.8 | 29.1 | 46.5 | 5.5 | 1.04 | 323 | 62.9 | 35.9 |
| 3/19/2007 | 720 | 7.80 | 424 | 61.7 | 28.8 | 48.1 | 5.2 | 1.00 | 329 | 68.7 | 36.7 |
| 4/1/2007 | 708 | 7.45 | 414 | 61.7 | 29.6 | 46.0 | 5.1 | 1.07 | 322 | 63.6 | 37.5 |
| 5/14/2007 | 723 | 7.50 | 414 | 63.7 | 29.3 | 47.0 | 5.2 | 1.07 | 319 | 62.6 | 37.0 |
| 6/1/2007 | 679 | 7.60 | 421 | 62.9 | 29.4 | 48.8 | 5.2 | 1.07 | 325 | 63.2 | 39.9 |
| 8/1/2007 | 701 | 7.21 | 421 | 63.0 | 29.4 | 48.3 | 5.3 | 1.07 | 334 | 62.9 | 35.2 |
| 10/1/2007 | 718 | 7.46 | 426 | 63.0 | 29.5 | 47.3 | 5.6 | 1.06 | 341 | 63.7 | 36.4 |
| 12/1/2007 | 744 | 7.36 | 396 | 61.7 | 29.1 | 46.5 | 5.3 | 1.05 | 327 | 45.0 | 35.5 |
| 1/25/2008 | 614 | 7.30 | 409 | 61.4 | 27.9 | 46.3 | 5.4 | 1.03 | 321 | 62.2 | 35.1 |
Table 14--Chemical analyses of samples collected during the June 2008 chemical-quality pumping test for Pittsburg 8.
| Date/Time Sampled |
Sp. Con. (µS/cm) |
T (°C) |
pH | TDS (mg/L) |
Ca (mg/L) |
Mg (mg/L) |
Na (mg/L) |
K (mg/L) |
Sr (mg/L) |
HCO3 (mg/L) |
SO4 (mg/L) |
Cl (mg/L) |
|---|---|---|---|---|---|---|---|---|---|---|---|---|
| 6/23/2008 11:01:00 |
968 | 22.5 | 6.89 | 566 | 70.9 | 32.1 | 100.8 | 5.8 | 1.10 | 315 | 68.8 | 131 |
| 6/23/2008 11:16:00 |
938 | 22.1 | 6.99 | 519 | 60.9 | 28.6 | 89.7 | 4.9 | 0.97 | 320 | 57.6 | 119 |
| 6/23/2008 11:31:00 |
935 | 22.1 | 6.93 | 521 | 62.7 | 29.2 | 92.2 | 5.1 | 1.00 | 318 | 56.6 | 118 |
| 6/23/2008 11:46:00 |
931 | 22.1 | 6.99 | 505 | 60.5 | 28.3 | 89.4 | 5.0 | 0.97 | 312 | 53.4 | 113 |
| 6/23/2008 12:14:00 |
922 | 22.4 | 6.97 | 519 | 61.2 | 28.8 | 90.7 | 5.0 | 0.98 | 319 | 55.1 | 119 |
| 6/23/2008 13:21:00 |
917 | 23.0 | 6.95 | 522 | 61.1 | 28.9 | 91.0 | 5.1 | 0.99 | 320 | 58.3 | 118 |
| 6/23/2008 14:21:00 |
919 | 22.8 | 6.94 | 523 | 61.2 | 28.8 | 91.7 | 5.1 | 1.00 | 318 | 60.9 | 117 |
| 6/23/2008 15:21:00 |
914 | 22.8 | 6.96 | 500 | 59.6 | 26.6 | 88.8 | 5.0 | 0.95 | 319 | 50.9 | 110 |
| 6/23/2008 16:29:00 |
906 | 22.8 | 7.04 | 506 | 59.4 | 28.6 | 89.8 | 4.9 | 0.98 | 317 | 50.9 | 115 |
| 6/23/2008 17:29:00 |
902 | 22.8 | 7.05 | 499 | 61.5 | 27.8 | 91.3 | 5.0 | 0.98 | 318 | 52.8 | 103 |
| 6/23/2008 18:29:00 |
894 | 22.6 | 7.10 | 515 | 61.4 | 27.4 | 91.4 | 5.2 | 0.99 | 319 | 58.5 | 113 |
| 6/23/2008 20:29:00 |
896 | 22.2 | 7.00 | 494 | 59.4 | 27.0 | 88.8 | 5.1 | 0.96 | 320 | 52.3 | 103 |
| 6/23/2008 22:29:00 |
888 | 21.7 | 7.01 | 493 | 59.3 | 26.9 | 88.9 | 5.1 | 0.97 | 320 | 47.2 | 107 |
| 6/24/2008 7:19:00 |
878 | 20.7 | 7.02 | 494 | 59.0 | 27.0 | 89.5 | 5.1 | 0.97 | 321 | 51.4 | 103 |
| 6/24/2008 9:19:00 |
874 | 21.4 | 6.99 | 477 | 56.1 | 25.8 | 85.6 | 4.9 | 0.92 | 321 | 41.5 | 104 |
| 6/24/2008 11:19:00 |
873 | 22.1 | 7.07 | 486 | 57.8 | 26.4 | 88.0 | 5.0 | 0.95 | 321 | 43.9 | 105 |
| 6/24/2008 13:19:00 |
876 | 22.6 | 7.05 | 485 | 58.1 | 26.6 | 88.9 | 5.0 | 0.96 | 319 | 47.7 | 100 |
| 6/24/2008 15:19:00 |
876 | 22.2 | 6.89 | 475 | 57.3 | 26.1 | 87.7 | 4.9 | 0.95 | 320 | 41.5 | 99 |
| 6/24/2008 17:19:00 |
872 | 22.3 | 6.99 | 450 | 58.0 | 26.4 | 88.3 | 5.0 | 0.96 | 323 | 41.6 | 99.9 |
| 6/24/2008 19:19:00 |
871 | 21.9 | 6.93 | 490 | 58.3 | 26.6 | 88.8 | 5.1 | 0.97 | 319 | 50.6 | 103 |
| 6/24/2008 21:19:00 |
869 | 21.8 | 6.99 | 475 | 57.1 | 26.0 | 87.3 | 5.0 | 0.95 | 320 | 43.8 | 97.1 |
| 6/24/2008 23:19:00 |
863 | 21.8 | 6.97 | 480 | 58.7 | 26.6 | 89.6 | 5.1 | 0.98 | 319 | 39.9 | 102 |
| 6/25/2008 7:28:00 |
866 | 21.1 | 6.95 | 458 | 56.2 | 25.8 | 86.3 | 5.0 | 0.93 | 320 | 35.6 | 89.9 |
| 6/25/2008 9:28:00 |
865 | 21.5 | 6.94 | 457 | 56.5 | 25.8 | 86.8 | 5.0 | 0.94 | 322 | 35.3 | 88.2 |
| 6/25/2008 11:28:00 |
865 | 22.3 | 6.96 | 470 | 58.1 | 26.3 | 88.5 | 5.1 | 0.96 | 315 | 39.8 | 95.6 |
| 6/25/2008 13:28:00 |
871 | 22.4 | 7.04 | 478 | 57.6 | 26.3 | 88.4 | 5.0 | 0.96 | 322 | 40.2 | 101 |
Table 15--Chemical analyses of samples collected during the September 2008 chemical-quality pumping test for Pittsburg 8.
| Date/Time Sampled |
Sp. Con. (µS/cm) |
T (°C) |
pH | TDS (mg/L) |
Ca (mg/L) |
Mg (mg/L) |
Na (mg/L) |
K (mg/L) |
Sr (mg/L) |
HCO3 (mg/L) |
SO4 (mg/L) |
Cl (mg/L) |
|---|---|---|---|---|---|---|---|---|---|---|---|---|
| 9/2/2008 9:40:00 |
975 | 22.0 | 7.2 | 520 | 64.7 | 29.2 | 94.0 | 5.3 | 1.04 | 315 | 53.9 | 116 |
| 9/2/2008 10:10:00 |
974 | 21.9 | 7.11 | 543 | 64.4 | 29.1 | 94.0 | 5.2 | 1.04 | 316 | 62.2 | 131 |
| 9/2/2008 10:40:00 |
972 | 22.0 | 7.32 | 533 | 65.5 | 28.6 | 93.0 | 5.3 | 1.01 | 316 | 60.4 | 123 |
| 9/2/2008 11:10:00 |
969 | 22.8 | 7.26 | 529 | 65.0 | 28.7 | 92.0 | 5.2 | 1.00 | 320 | 47.6 | 132 |
| 9/2/2008 11:40:00 |
970 | 23.3 | 7.17 | 524 | 63.6 | 28.5 | 90.0 | 5.1 | 0.98 | 317 | 65.7 | 114 |
| 9/2/2008 12:10:00 |
968 | 23.8 | 7.11 | 509 | 64.3 | 28.8 | 91.0 | 5.2 | 0.99 | 317 | 51.3 | 111 |
| 9/2/2008 12:40:00 |
928 | 23.6 | 7.09 | 505 | 62.0 | 27.7 | 89.0 | 5.0 | 0.96 | 317 | 51.2 | 113 |
| 9/2/2008 13:40:00 |
933 | 23.4 | 7.15 | 517 | 65.0 | 29.5 | 93.0 | 5.2 | 1.01 | 317 | 48.5 | 118 |
| 9/2/2008 14:40:00 |
961 | 23.5 | 7.17 | 507 | 63.5 | 29.0 | 92.0 | 5.2 | 0.99 | 318 | 49.0 | 110 |
| 9/2/2008 15:40:00 |
931 | 23.3 | 7.02 | 487 | 61.7 | 28.4 | 91.0 | 5.3 | 0.94 | 317 | 46.3 | 97 |
| 9/2/2008 16:40:00 |
956 | 23.3 | 7.11 | 514 | 64.0 | 29.2 | 92.0 | 5.1 | 1.01 | 318 | 58.6 | 107 |
| 9/2/2008 17:40:00 |
953 | 23.0 | 7.15 | 505 | 61.9 | 28.5 | 90.0 | 5.0 | 0.98 | 317 | 51.9 | 110 |
| 9/2/2008 18:40:00 |
950 | 22.4 | 7.18 | 485 | 60.6 | 28.1 | 90.0 | 5.3 | 0.92 | 317 | 46.0 | 98 |
| 9/2/2008 20:40:00 |
927 | 21.3 | 7.13 | 494 | 63.0 | 28.5 | 92.0 | 5.1 | 1.00 | 317 | 45.3 | 103 |
| 9/2/2008 22:40:00 |
945 | 21.3 | 7.14 | 516 | 63.8 | 28.9 | 94.0 | 5.2 | 1.02 | 317 | 54.3 | 112 |
| 9/3/2008 1:40:00 |
937 | 7.18 | 503 | 62.7 | 28.5 | 92.0 | 5.1 | 1.00 | 317 | 52.9 | 104 | |
| 9/3/2008 4:40:00 |
928 | 7.24 | 506 | 63.1 | 28.3 | 93.0 | 5.2 | 1.01 | 316 | 50.8 | 109 | |
| 9/3/2008 7:40:00 |
916 | 19.4 | 7.21 | 513 | 63.3 | 28.7 | 93.0 | 5.1 | 1.02 | 318 | 57.6 | 107 |
| 9/3/2008 10:40:00 |
926 | 20.6 | 7.27 | 503 | 61.1 | 27.5 | 90.0 | 5.0 | 0.99 | 318 | 49.6 | 112 |
| 9/3/2008 13:40:00 |
928 | 20.6 | 7.28 | 501 | 62.3 | 28.4 | 92.0 | 5.3 | 1.00 | 318 | 53.6 | 102 |
| 9/3/2008 16:40:00 |
918 | 20.3 | 7.27 | 503 | 61.9 | 27.6 | 92.0 | 5.1 | 1.00 | 317 | 50.3 | 109 |
| 9/3/2008 19:40:00 |
919 | 20.2 | 7.30 | 496 | 60.9 | 27.5 | 92.0 | 5.4 | 0.99 | 318 | 46.1 | 106 |
| 9/3/2008 22:40:00 |
913 | 20.1 | 7.29 | 493 | 61.3 | 27.2 | 91.0 | 5.1 | 0.99 | 318 | 45.1 | 105 |
| 9/4/2008 1:40:00 |
910 | 7.33 | 506 | 61.5 | 27.5 | 92.0 | 5.1 | 1.00 | 317 | 46.9 | 116 | |
| 9/4/2008 4:40:00 |
913 | 7.34 | 487 | 58.8 | 26.2 | 88.0 | 4.9 | 0.95 | 317 | 44.0 | 108 | |
| 9/4/2008 7:40:00 |
908 | 20.3 | 7.34 | 489 | 60.0 | 27.0 | 90.0 | 5.0 | 0.98 | 318 | 42.6 | 106 |
| 9/4/2008 10:40:00 |
910 | 20.1 | 7.28 | 484 | 59.6 | 26.8 | 89.0 | 5.0 | 0.97 | 316 | 42.0 | 105 |
| 9/4/2008 12:57:00 |
907 | 21.6 | 7.32 | 500 | 62.6 | 27.8 | 93.9 | 5.1 | 1.02 | 317 | 52.1 | 102 |
Graphical displays of the concentration data were used to explore spatial and temporal relationships and develop mixing relationships between constituents and constituent ratios that represent the contributions of end-member ground waters of differing chemistry to the produced waters sampled in this project. The diamond-shaped field of the Piper diagram (Piper, 1944) was modified by rotation of the coordinate axes 90° to allow for easier plotting and display of the monthly sample data from spreadsheets.
Mixing curves are useful for testing the hypothesis that a given water is a mixture of two end-member waters of differing chemistry based on their dissolved constituents. In the case of two end-member mixtures, the relationship between relative amounts and observed end-member concentrations and the mix in a water sample can be expressed as a mass balance equation (Hem, 1985):
C1V1 + C2V2 = C3(V1 + V2), (1)
where C1 and C2, and V1 and V2, are the constituent concentrations and the volumes from sources 1 and 2, respectively, and C3 and (V1 + V2) are the constituent concentration and the volume of water produced at the well. In the case of relative contributions, the quantity (V1 + V2) is equal to 1, and V1 and V2 are volume fractions.
Monthly pumpage data could not be obtained for most of the wells sampled because of the manner in which water withdrawals are tabulated by the water utilities. Some of the utilities rely on sources of both ground water from the Ozark Plateau aquifer system and surface water from Bone Creek Reservoir in Crawford County. Thus, it is difficult to quantify withdrawals from individual wells. However, on the basis of the types of pumps, the pumping rate, and frequency of use information, it is likely that Pittsburg 8 and Girard 3 are used more heavily than any of the other wells in this study.
Prev Page--Introduction, Regional Information || Next Page--Results
Kansas Geological Survey
Placed online June 25, 2010
http://www.kgs.ku.edu/Current/2010/Macfarlane/03_method.html
email:webadmin@kgs.ku.edu